


Comprehensive Guide to Exchange-Traded Funds (ETFs): What You Need to ...
Exchange-Traded Funds (ETFs) have become increasingly popular investment vehicles in ...

The ongoing debate between active and passive funds has become a staple in the financial world. Active funds involve fund managers conducting in-depth research to create portfolios and generate alpha compared to a benchmark. This, however, comes at the cost of fees, typically represented as an expense ratio. On the other hand, passive fund management aims to replicate market indexes without intensive research, seeking returns in line with the index itself. In theory, active funds, with their meticulous stock selection, should outperform their benchmarks. But in reality, they often fall short, consistently underperforming the market indexes.
S&P Dow Jones, a global financial entity, conducts a thorough analysis of the active versus passive funds debate. In finance, numbers carry significant weight. For those interested in understanding how actively managed mutual funds stack up against their benchmark indices, the SPIVA report, brought to you by S&P Dow Jones, is a valuable source of insights.
SPIVA, short for S & P Indices versus Active, serves as the industry’s yardstick for evaluating the performance of actively managed funds in comparison to the appropriate market benchmarks. This comprehensive research initiative has been unfolding across nine countries for two decades, continuously shedding light on the ever-evolving investment landscape.
SPIVA’s coverage extends to Latin America, the United States, Canada, Europe, the Middle East, North Africa, South Africa, India, Japan, and Australia. Across these regions, SPIVA examines more than 100 categories, providing an extensive analysis of the investment landscape. Their scorecard, or research report, is published semi-annually, establishing itself as a trusted resource for investors and professionals.
The most recent SPIVA report for Indian mutual funds, released in June 2023, reveals a thought-provoking narrative. Let’s delve into its key takeaways.
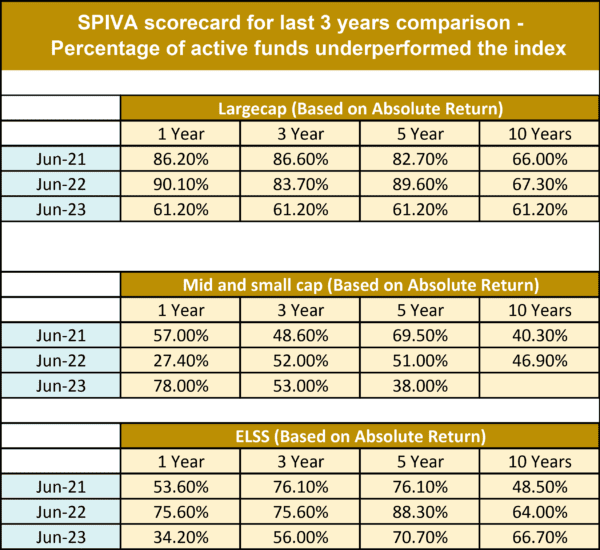
The report highlights a stark reality in the large-cap fund segment. Over the one-year time frame, a staggering 83% of large-cap funds have underperformed the S&P BSE 100 Index. This trend continues into the three-year and five-year horizons, with 86% and 93% of funds underperforming, respectively. However, over a ten-year period, the underperformance rate drops to 61%, offering a glimmer of hope for long-term investors.
The Equity-Linked Savings Scheme (ELSS) category, often chosen for tax-saving purposes under Section 80C, tells an intriguing story. Over the one-year window, 34% of ELSS funds underperform the S&P BSE 200, while this figure rises to 56% over three years, 71% over five years, and 67% over a decade. In response to these statistics, SEBI has introduced a new category – Index ELSS funds. This innovative offering combines the benefits of tax-saving and index funds, providing an enticing blend for investors.
In the mid and small-cap fund segment, the numbers are slightly more favorable. In the one-year timeframe, 78% of these funds underperform the S&P BSE 400 Mid and Small Cap Index. Over three years, this figure improves to 53%, and further drops to 38% over five years. Investors in this category may find some solace in these statistics.
The SPIVA report also sheds light on the performance of debt mutual funds. Under the Indian Composite Bond Fund category, a concerning 94% of funds underperformed the S&P BSE Bond Index over one year, 65% over three years, and a striking 99% over five years. The story is not much different for government bonds, with 88% of funds underperforming over one year, 75% over three years, and 67% over five years.
Percentage of active funds underperformed the index
Asset management companies have expressed dissent with several aspects of the SPIVA report’s findings. AMCs contend that the report, in their view, inappropriately compares their own indexes and not with the actual indexes that the funds are tracking.
The report does not mention that in India funds are compared with Total return index and not principle return index, globally when fund performance is compared with total return index its with gross of expenses.
Furthermore, AMCs argue that utilizing rolling returns as a comparison metric is more accurate and insightful than relying solely on point-to-point returns. According to their perspective, rolling returns provide a broader and more comprehensive view of a fund’s performance over time, taking into account various market conditions and fluctuations.
In essence, asset management companies emphasize the importance of a nuanced approach to evaluating their funds’ performance and assert that a more in-depth analysis, considering factors like index type and the methodology of return comparison, is crucial for a comprehensive assessment.
Highlighting the growth of Assets Under Management (AUM) in active versus passive funds. As of September 2023, active AUM (including equity and hybrid) stands at around 25 lakh crore, compared to 17.7 lakh crore in September 2021. Passive AUM, which includes Index funds, ETFs, FOF overseas, Gold ETFs, and Other ETFs, has also seen substantial growth, reaching 7.9 lakh crore in September 2023, up from 4.34 lakh crore in September 2021.
In an industry where performance is paramount, the SPIVA report is a crucial tool for investors seeking transparency and data-driven insights. As we navigate the complex world of investments, staying informed and adapting to changing trends is paramount. SPIVA helps us do just that, providing a valuable resource for investors and professionals alike.

The views in the article /blog are personal and that of the author. The idea is to create awareness and not intended to provide any product recommendations.


Exchange-Traded Funds (ETFs) have become increasingly popular investment vehicles in ...

Priya, a 28-year-old IT professional based in Bangalore has recently received a bonus...

Know the risks of multi-asset funds, not just returns