

Lately, multi-asset allocation funds (MAAFs) have been popping up with impressive performance numbers, with many AMCs tagging them as an “all-in-one solution” due to their diversified mix. At first glance, you may think they are beating other categories with their so-called “impressive returns”, but we at 1 Finance did some digging around those numbers.
And found ourselves questioning: What is really driving those returns?
Is it the multi-asset allocation, or is there something else at play? The charts look appealing, and the AMCs’ messaging makes them sound like a smart choice for “all kinds of investors”. However, a closer look reveals something else, which raises even bigger questions:
- Is a multi-asset allocation fund’s generic asset allocation really the right fit for your goals?
- If goals are personalized, how can this generic mix suit all kinds of investors?
While we see value in what multi-asset allocation funds offer, we want you to be quite cautious about following the crowd for convenience alone. That’s why, in this article, we will gain some clarity about the funds, decode the reason behind the seemingly impressive returns, and understand whether the asset mix of equities, debt, and gold really suits your financial personality.
What are multi-asset allocation funds?
Securities and Exchange Board of India (SEBI) defines multi-asset allocation funds as a type of mutual fund that invests a minimum of 10% in at least three different asset classes like equity, debt, and commodities.
Their average asset allocation look something like this:
- ~60-65% equities
- ~25-30% debt
- ~10% or more commodities (mostly gold and silver)
- The remaining can be cash or real estate (if any)
The fund manager changes the ratio as per market conditions, while maintaining strictly 10% in each asset class. This asset allocation delivers diversification in one package. Hence, promising an “all-in-one solution” hype, causing many investors to consider them. The recent returns also helped in attracting more investors.
But here’s what many miss: the real returns over the past year haven’t come from equities at all, as many AMCs subtly suggest. So, what’s really driving the performance?
The truth behind multi-asset allocation funds returns in 2025: It’s not equities!
We examined the top multi-asset allocation funds by AUM size to see how scale reflects investor trust and how they performed in the last one year. Let’s break it down.
Multi-asset allocation funds: AUM size & returns (1Y%)
| Scheme name | AUM size (₹ crores) | Direct plan 1Y (%) | Regular plan 1Y (%) |
|---|---|---|---|
| ICICI Pru Multi-Asset Fund | 64770.2 | 9.29 | 8.49 |
| SBI Multi Asset Allocation Fund | 9819.38 | 8.8 | 7.84 |
| Kotak Multi Asset Allocation Fund | 8373.72 | 7.39 | 5.96 |
| Nippon India Multi Asset Allocation Fund | 6959.46 | 12.3 | 10.97 |
| UTI Multi Asset Allocation Fund | 5940.72 | 4.62 | 3.36 |
Source: 1 Finance Research, as of September 2025
Scroll right to view full table –>
On the surface, these funds delivered good returns. But let’s see their underlying allocation:
Multi-asset allocation funds: Asset allocation (%)
| Fund scheme | Equity | Debt | Gold |
|---|---|---|---|
| ICICI Pru Multi-Asset Fund | 66.19 | 13.97 | 3.06 |
| SBI Multi Asset Allocation Fund | 41.38 | 35.75 | 3.34 |
| Kotak Multi Asset Allocation Fund | 69.15 | 9.43 | 5.41 |
| Nippon India Multi Asset Allocation Fund | 56.88 | 14.05 | 11.19 |
| UTI Multi Asset Allocation Fund | 66.09 | 12.36 | 11.19 |
Source: 1 Finance Research, as of September 2025
Scroll right to view full table –>
Also read: Multi-asset allocation fund vs. gold ETF: Which one to choose for gold exposure in 2025?
1 Finance analysis
Now here’s where the picture becomes clearer. While the table reveals that equities occupy the largest share in most of these portfolios, it is gold that contributed to returns.
In the past year, gold has delivered ~40% returns. In contrast, equity performance contributed less to returns due to relatively less market gains, with certain indices or sectors underperforming. As per NSE Indices website, Nifty 50 has underperformed, giving -2.01% 1Y return, as of August 30th, 2025. It’s clear that many of these funds benefited from their gold exposure.
Every asset class goes through its market cycles of ups and downs, and that’s what we witnessed in the case of equities here. This isn’t necessarily a great multi-asset strategy at work, but a case of the right place (gold) at the right time. Still, many AMCs are presenting these funds as “outperformers”, giving the impression that it’s their diversified model that is working, which is misleading.
How much cost are you paying?
Now, let’s address what it’s costing you to invest in these funds.
Multi-asset allocation funds: Direct & regular plans’ expense ratios (%)
| Scheme name | Direct plan | Regular plan |
|---|---|---|
| ICICI Pru Multi-Asset Fund | 0.66 | 1.38 |
| SBI Multi Asset Allocation Fund | 0.58 | 1.42 |
| Kotak Multi Asset Allocation Fund | 0.44 | 1.73 |
| Nippon India Multi Asset Allocation Fund | 0.28 | 1.44 |
| UTI Multi Asset Allocation Fund | 0.59 | 1.73 |
Source: 1 Finance Research, as of September 2025
Scroll right to view full table –>
As you can see, the direct plans of multi-asset allocation funds can be relatively expensive if you couple it with other schemes in your portfolio. The difference is more stark in regular plans due to their higher expense ratios.
To explain quickly, an expense ratio is the annual fees (expressed as a percentage) you have to pay to the fund house for managing your money. A value closer to 1% or more is usually considered higher.
From what we can conclude (taking into account returns, asset allocation, and expense ratios), you are overpaying to build a diversified portfolio with a multi-asset allocation fund. You don’t pay this separately. This fee is automatically adjusted in your returns. In other words, it’s the “hidden cost” you are paying.
Here’s the thing: you could easily achieve similar performance by directly allocating to individual asset classes (say, equity + gold + debt funds), using low-cost schemes, as shown in the table below.
Individual asset class: Direct plan expense ratios
| Asset type | Average expense ratio (%) |
|---|---|
| Equity Index Funds | 0.10 – 0.20 |
| Gold ETFs/Funds | 0.45 – 0.60 |
| Debt Funds (Liquid/Short-Term) | 0.20 – 0.40 |
Scroll right to view full table –>
As you can see, building your own mix with direct plans is relatively cost-efficient. You are being sold a ‘package’ in the name of diversification. And while the package seems convenient, it can cost more than building your own diversified mix.
How does the expense ratio affect your overall cost?
Let’s compare two scenarios over a 10-year period, assuming a monthly investment of ₹5,000, an annual return of 10%, and different average expense ratios.
Scenario 1: Using just low-cost funds
| Investment type | Average expense ratio | Expected future vaue (10 years) | Total fees deducted |
|---|---|---|---|
| Equity + Debt + Gold | 0.60% | ₹9,86,090 | ₹5,916 |
Scroll right to view full table –>
Scenario 2: Including a multi-asset allocation fund
| Investment type | Average expense ratio | Expected future vaue (10 years) | Total fees deducted |
|---|---|---|---|
| Custom Mix + MAAF | 1.00% | ₹9,86,090 | ₹9,860 |
Scroll right to view full table –>
Please note that the above tables are intended as an example only.
The difference in fees is ₹3,944, and you pay this much just for the convenience. So, is the extra cost really worth it? And does this convenience align with your unique financial goals?
Why generic asset allocation may not match your investment goals
An asset allocation is simply how you divide your money across different types of assets, usually equity (stocks), debt (bonds/fixed income), gold/silver, or other alternatives like real estate. Its key intention is to make the best use of each asset class across different market conditions.
For example, equities perform better when the market sees an upward trend. Commodities like gold or silver hold their value during inflation or volatile conditions, when other assets underperform. It gives you the benefit of strategic asset allocation.
Personal goals need personalised allocations
Here’s where it gets critical. Multi-asset allocation funds returns are not tailor-made for your needs. It is a generic mix decided by the fund manager and not you. This defeats the point of strategic allocation.
Here’s an example with two different people: a 25-year-old professional who seeks short-term opportunities and a 30-year-old cautious player who believes in playing the safe game.
- The 25-year-old professional is impulsive and chases market trends. He often gets influenced by the latest news. His asset allocation would like this:
- 45% in an asset or a sector currently trending
- 30% in diversified equity funds
- 25% in debt funds
Conclusion: He likes the thrill of higher returns in a shorter time frame and doesn’t want to regret missing opportunities.
- The 40-year-old fears market volatility and prefers safety over chasing short-term opportunities. His asset allocation would look like this:
- 55% in fixed deposits, bonds or debt funds
- 25% in equity funds (mostly large-cap or index funds)
- 20% in gold
Conclusion: This asset allocation tends to provide steady returns while also protecting the capital.
As you see, their financial personalities differ. That 25-year-old professional has different beliefs towards investing, risk comfort, goals, and money habits than the 30-year-old. Do you think that if both had invested in a multi-asset allocation fund that had a fixed allocation, it would have been the right fit for them? We don’t think so, as evidenced by their asset choices.
If your goal is genuine diversification, it usually makes more sense to build an allocation at the portfolio level that actually reflects your financial situation and comfort with risk.
Asset allocation is highly personal, shaped by your beliefs, your age, and importantly, your financial personality.
Understanding financial personality and why it’s important for your asset allocation
Financial personality is how you naturally deal with money. Your emotional response to money, your habits surrounding spending and savings, and in this case, market swings. This financial personality ties up with asset allocation too, as we saw with the examples above. Remember this: asset allocation should depend on you. It should align with your comfort level and long-term goals.
Now, once you decide your allocation, the next question is: what is the cost of maintaining that portfolio? To know the true cost of your portfolio, you need to calculate the effective expense ratio. Let’s see how this works with an example:
| Asset type | Portfolio allocation (%) | Expense ratio (%) |
|---|---|---|
| Equity | 65 | 0.1 |
| Debt | 20 | 0.4 |
| Gold | 15 | 0.55 |
Scroll right to view full table –>
Multiply each allocation by its expense ratio:
- Equity: 65% × 0.10% = 0.065%
- Debt: 20% × 0.40% = 0.080%
- Gold: 15% × 0.55% = 0.0825%
Effective portfolio expense ratio ≈ 0.23% (0.065 + 0.080 + 0.0825)
Here’s the result of the 20-year comparison between your low-cost portfolio (0.23% ER) and a typical multi-asset allocation fund (1.5% ER):
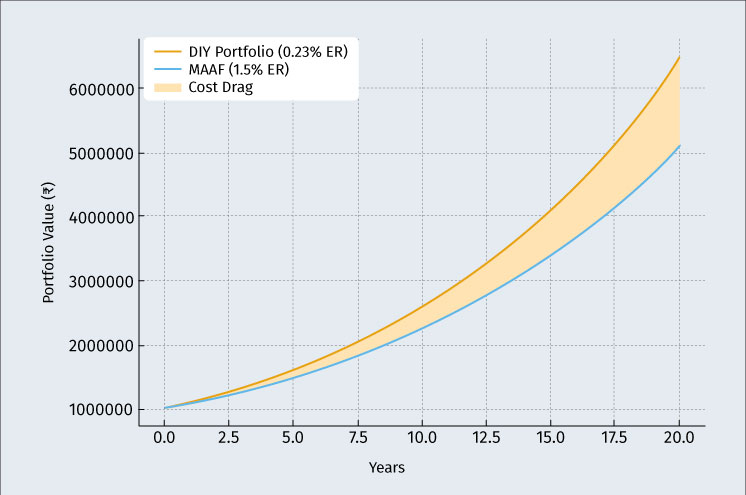
- Your invested amount: ₹10 lakh
- Personalised portfolio (0.23% ER): ₹64.5 lakh
- MAAF (1.5% ER): ₹51.1 lakh
- Cost drag difference: ~₹13.4 lakh
The chart above clearly shows how the gap widens with time due to compounding. Even though the annual difference in expense ratios looks small (1.27%), over 20 years it compounds into a loss of more than ₹13 lakh on just ₹10 lakh invested.
Before investing in funds like multi-asset allocation fund, consider what really matters:
- Does this additional equity allocation suit your needs?
- Does it match your risk personality?
- Is it aligned with your financial goals?
- Are you paying any hidden costs?
Most investors don’t pause to ask these questions. Instead of solving the problem of allocation, investors often end up with duplication and end up paying extra. For example, someone who already has equity-heavy funds, adding a multi-asset allocation fund is just adding more equities.
This is where consulting with a qualified financial advisor (QFA) can really make a difference. You may think you have the right allocation, but the market swings will test your decision, and the truth will show up. So, why not go for a proper asset allocation and pay less in the first place?
A qualified financial advisor will sit with you, figure out what kind of investor you really are, and then suggest an asset allocation that actually works with your investment psychology and comfort level. More like a coach genuinely looking after your interests than someone selling financial products.
Read more about financial personality.
Conclusion
The strong takeaway is this: asset allocation is hyper-personalized. It cannot be generic, and no single fund can decide it for you. Multi-asset allocation funds are presented as a “one-stop solution” for all asset allocation needs. In fact, many AMCs are marketing them using these returns, without providing any clarity to investors.
Does this mean they are completely misleading? Not exactly. But it does mean that you need to look beyond the headlines and choose what is best for you, according to your financial personality.