Popular searches
Product scoring may vary based on gender, age, policy tenure and sum assured.


The lowest age in the selected range is considered for price evaluation (e.g., 25 - 29)


Get a financial plan personalised to your needs
Let our Qualified Financial Advisors guide you
The calendar has turned to 2026, but the global economy is not starting from scratch. It enters the year shaped by the after-effects of 2025, a period marked by slowing growth, elevated policy uncertainty, and rising trade tensions. A global recession was avoided, but only after central banks delivered one of the broadest easing cycles in recent years, cushioning liquidity and stabilising financial conditions.
Markets reflected this unusual mix of slowing growth and abundant liquidity. Equity gains were narrow, driven largely by AI optimism and a handful of U.S. mega-cap stocks. Precious metals outperformed as gold and silver rallied on falling rates and persistent geopolitical risks.
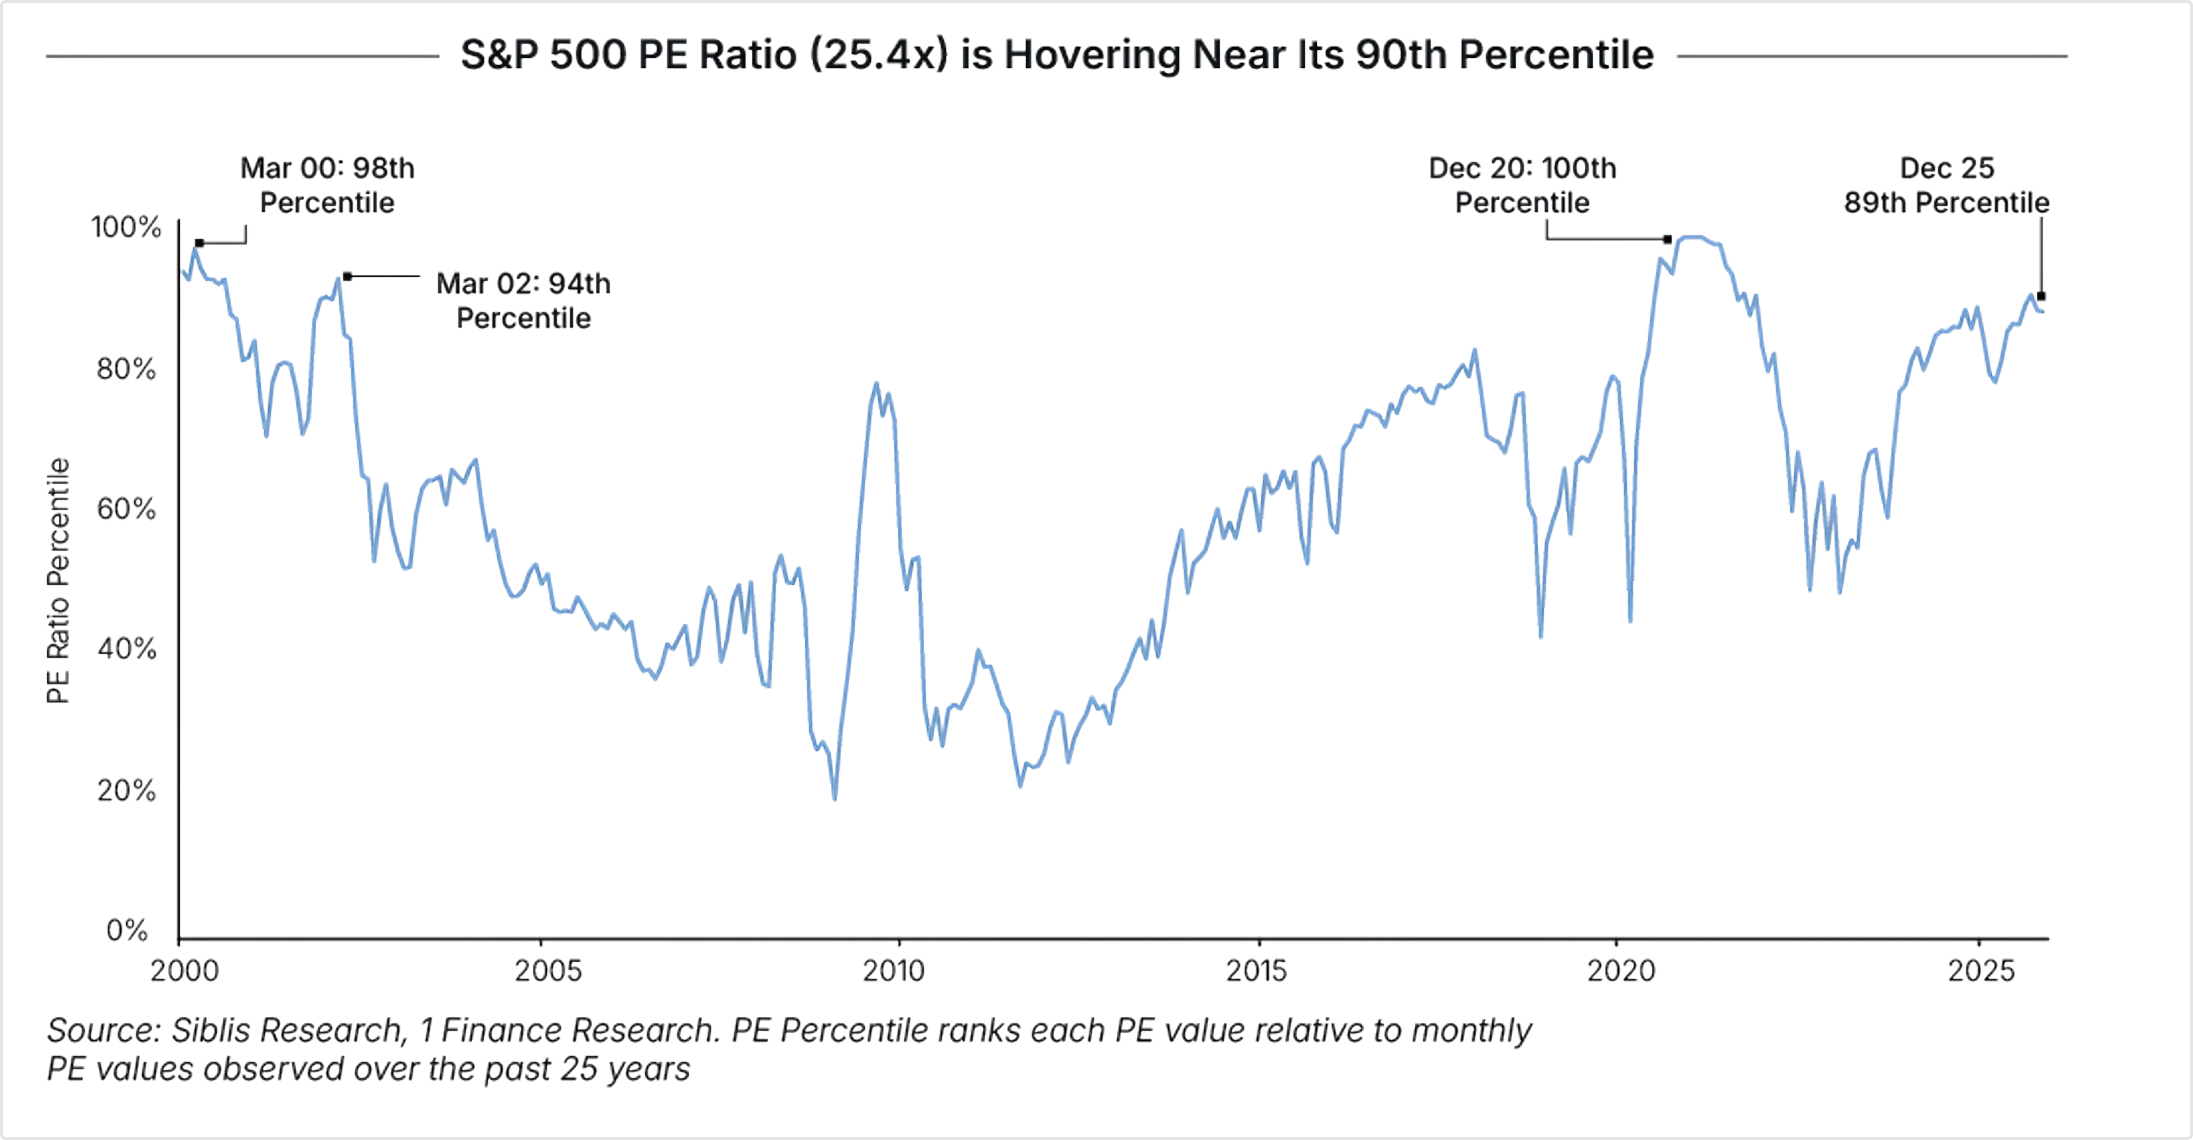
As we move into 2026, the global backdrop appears more balanced but also more demanding. Growth is stabilising rather than accelerating. The easing cycle is losing momentum. Liquidity remains supportive, but it is no longer expanding. From here, valuations will require support from earnings rather than rate expectations.
Within this global setting, India’s position looks increasingly constructive. While it underperformed several developed markets in 2025, it enters 2026 with improving domestic momentum:
- Inflation is projected at 3.9% in 2026, slightly below the RBI’s 4% target, leaving room for 50-75 bps of calibrated easing.
- The 1Finance Macroeconomic Index has moved into Strong Recovery territory, suggesting the slowdown was cyclical, not structural.
- Over 22 banking reforms, tax cuts, and credit measures are expected to strengthen transmission, liquidity, and investment sentiment.
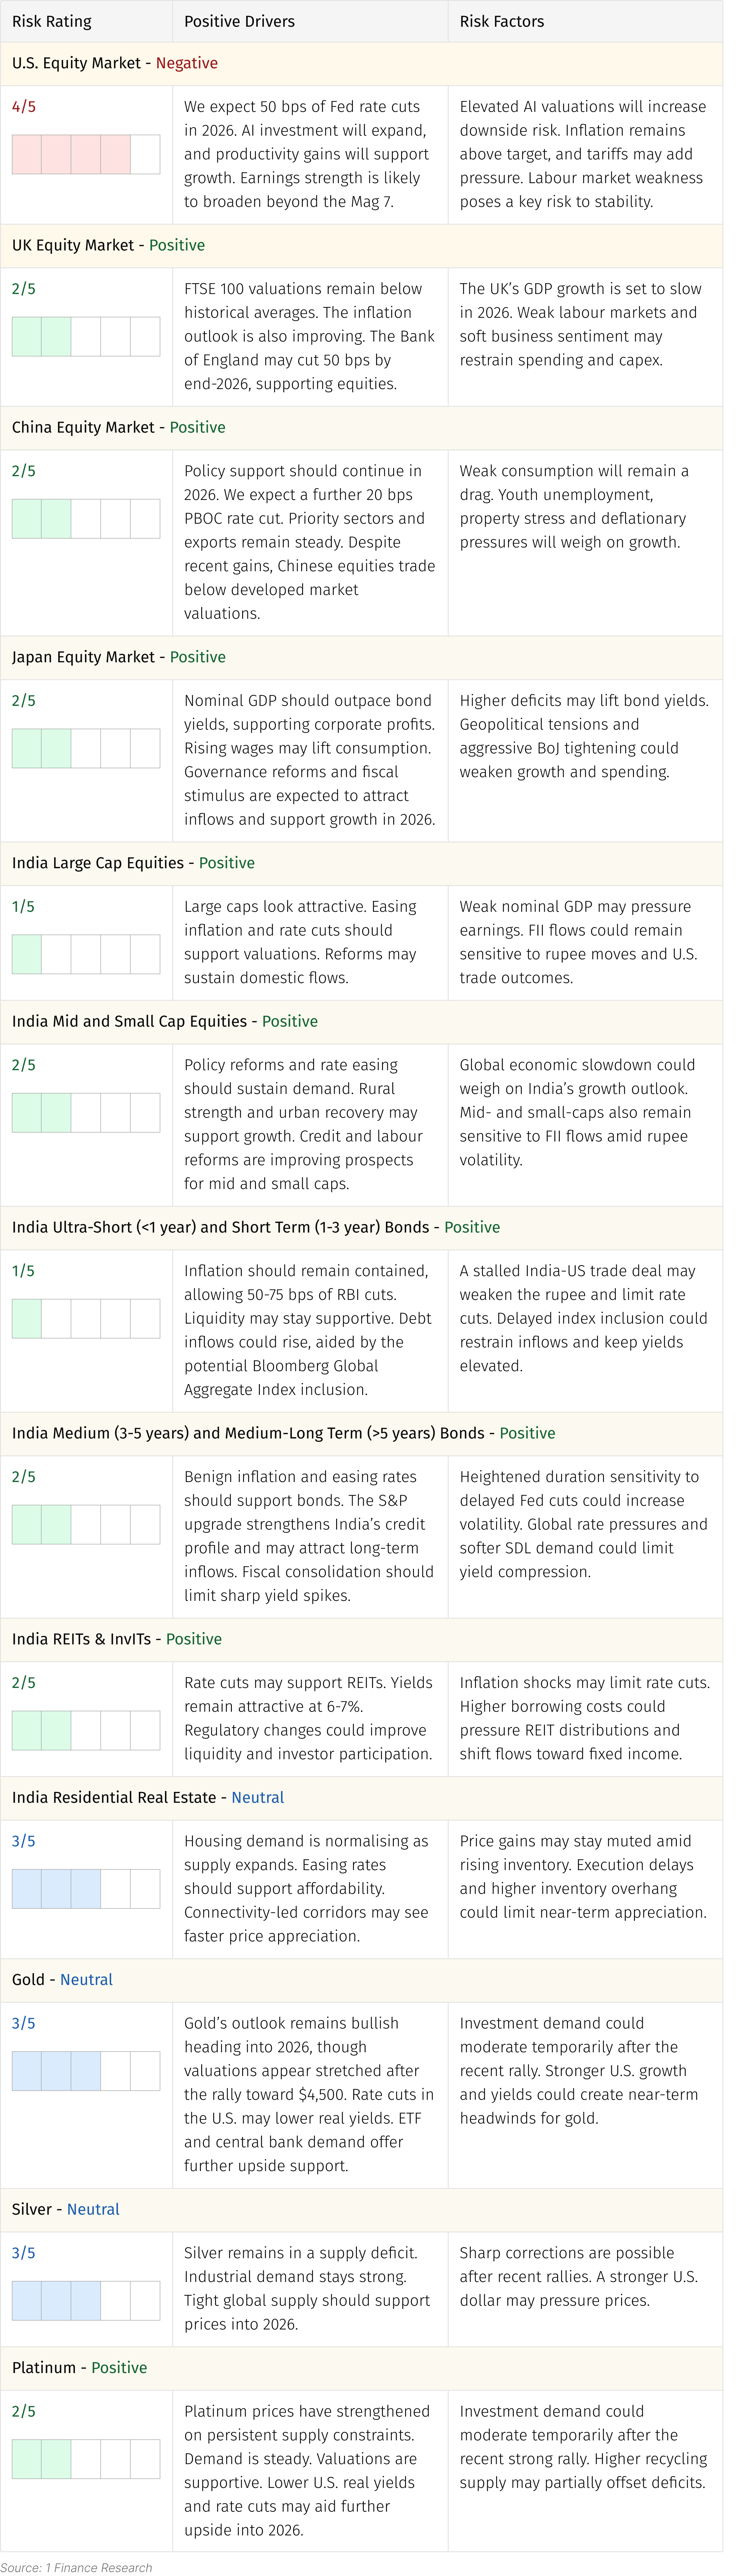
This is not a year for extremes. It calls for selective positioning and disciplined diversification. This outlook weighs these factors to present our comprehensive analysis across asset classes, focusing on key themes that will shape investment opportunities in 2026.
Recent improvements across industrial activity, services momentum, consumer inflation, and global uncertainty suggest that the slowdown was cyclical rather than structural. Multiple sub-indices within 1FMI have shifted upward simultaneously, reinforcing the view that growth momentum is rebuilding.
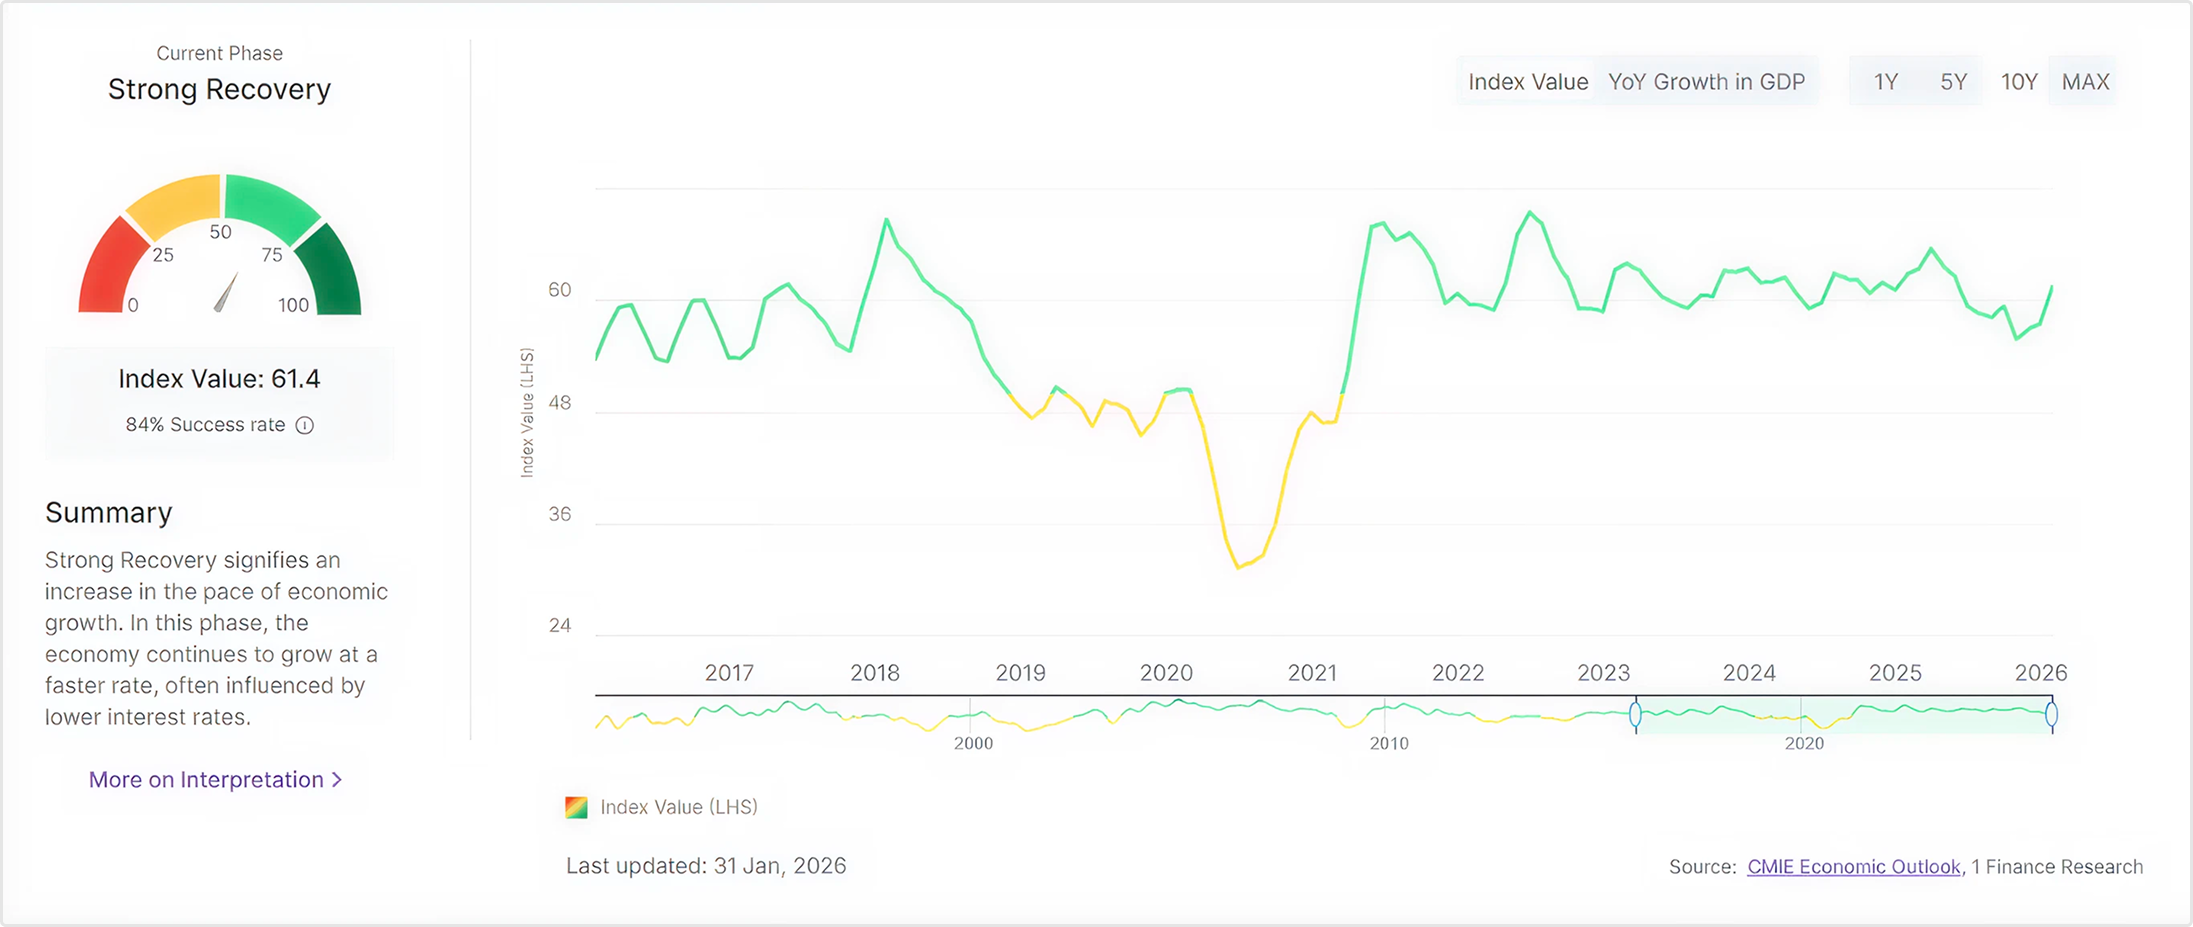
Note: The 1Finance Macroeconomic Index (1FMI) integrates multiple sub-indices derived from high-frequency indicators to provide a comprehensive view of India's economic trends, cyclical phases, and near-to-medium-term outlook.
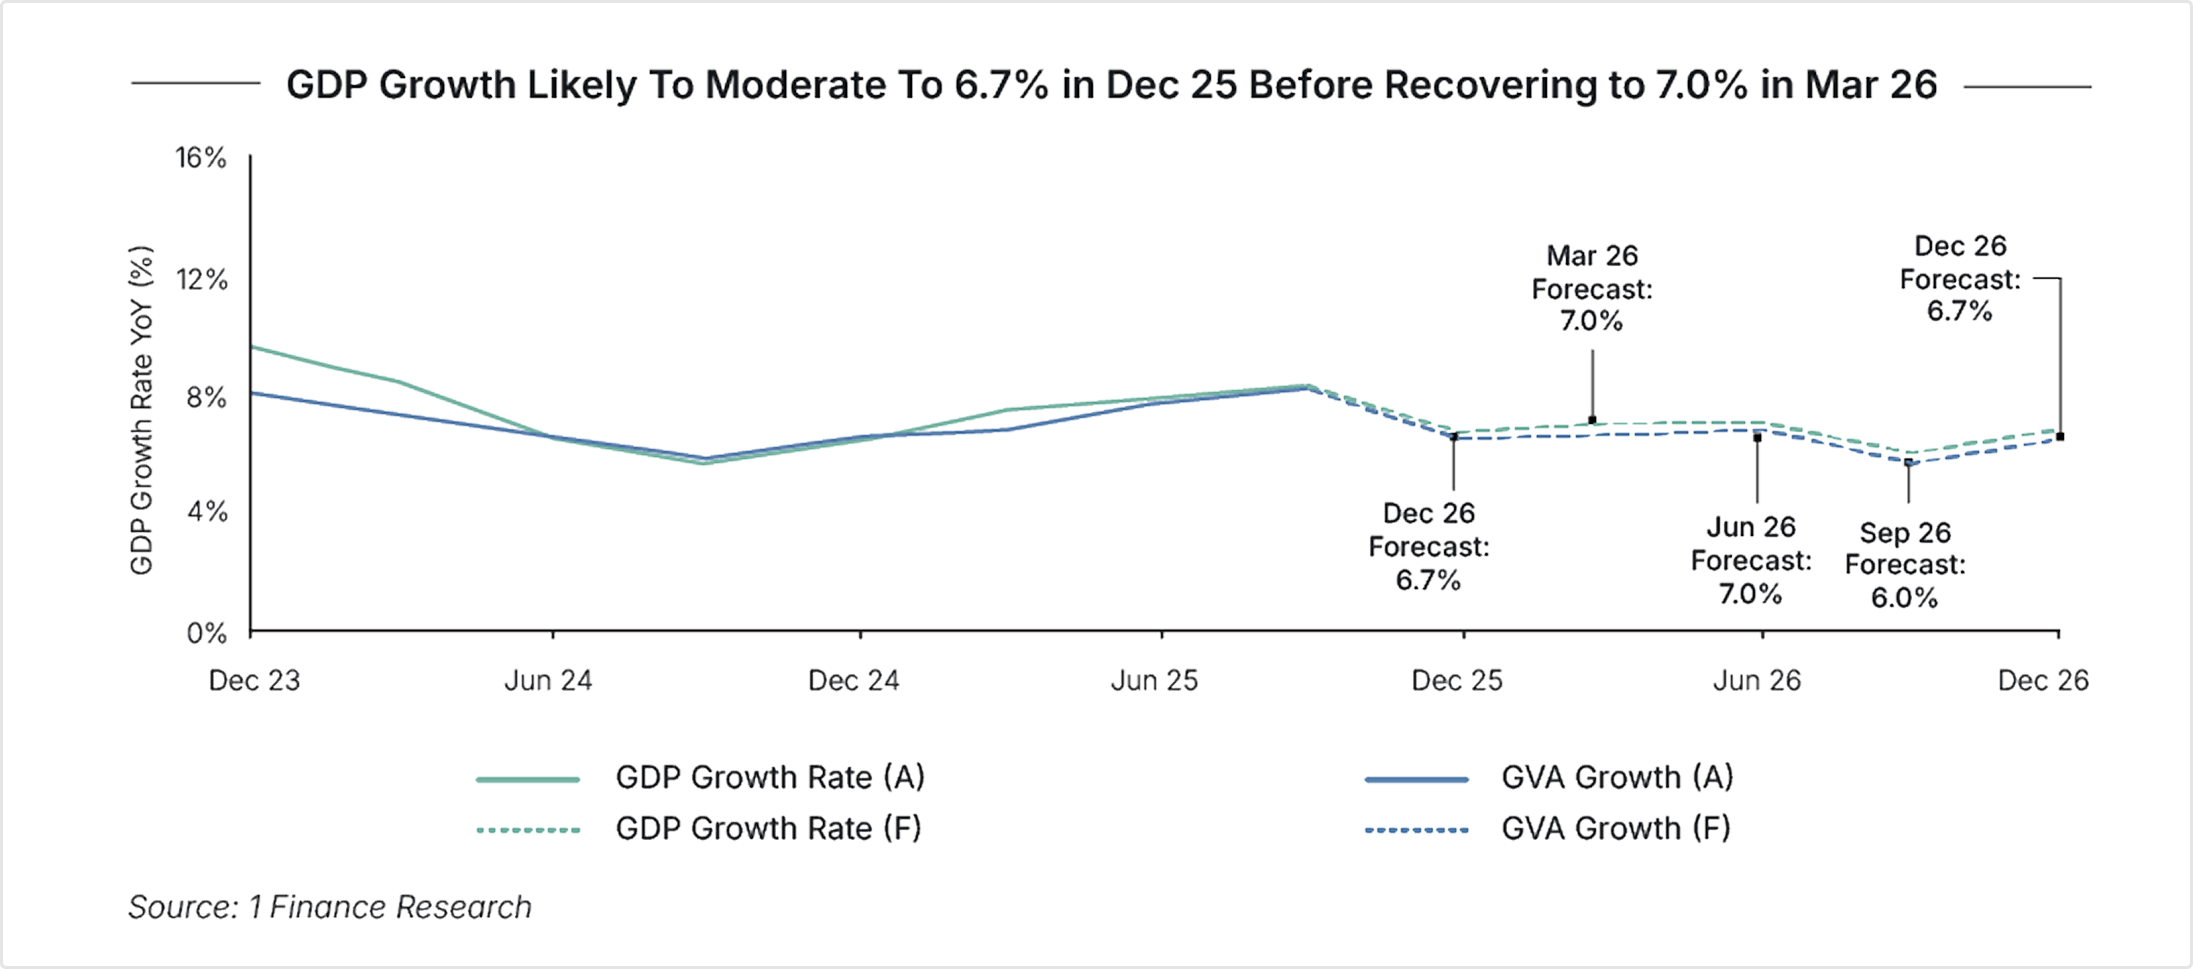
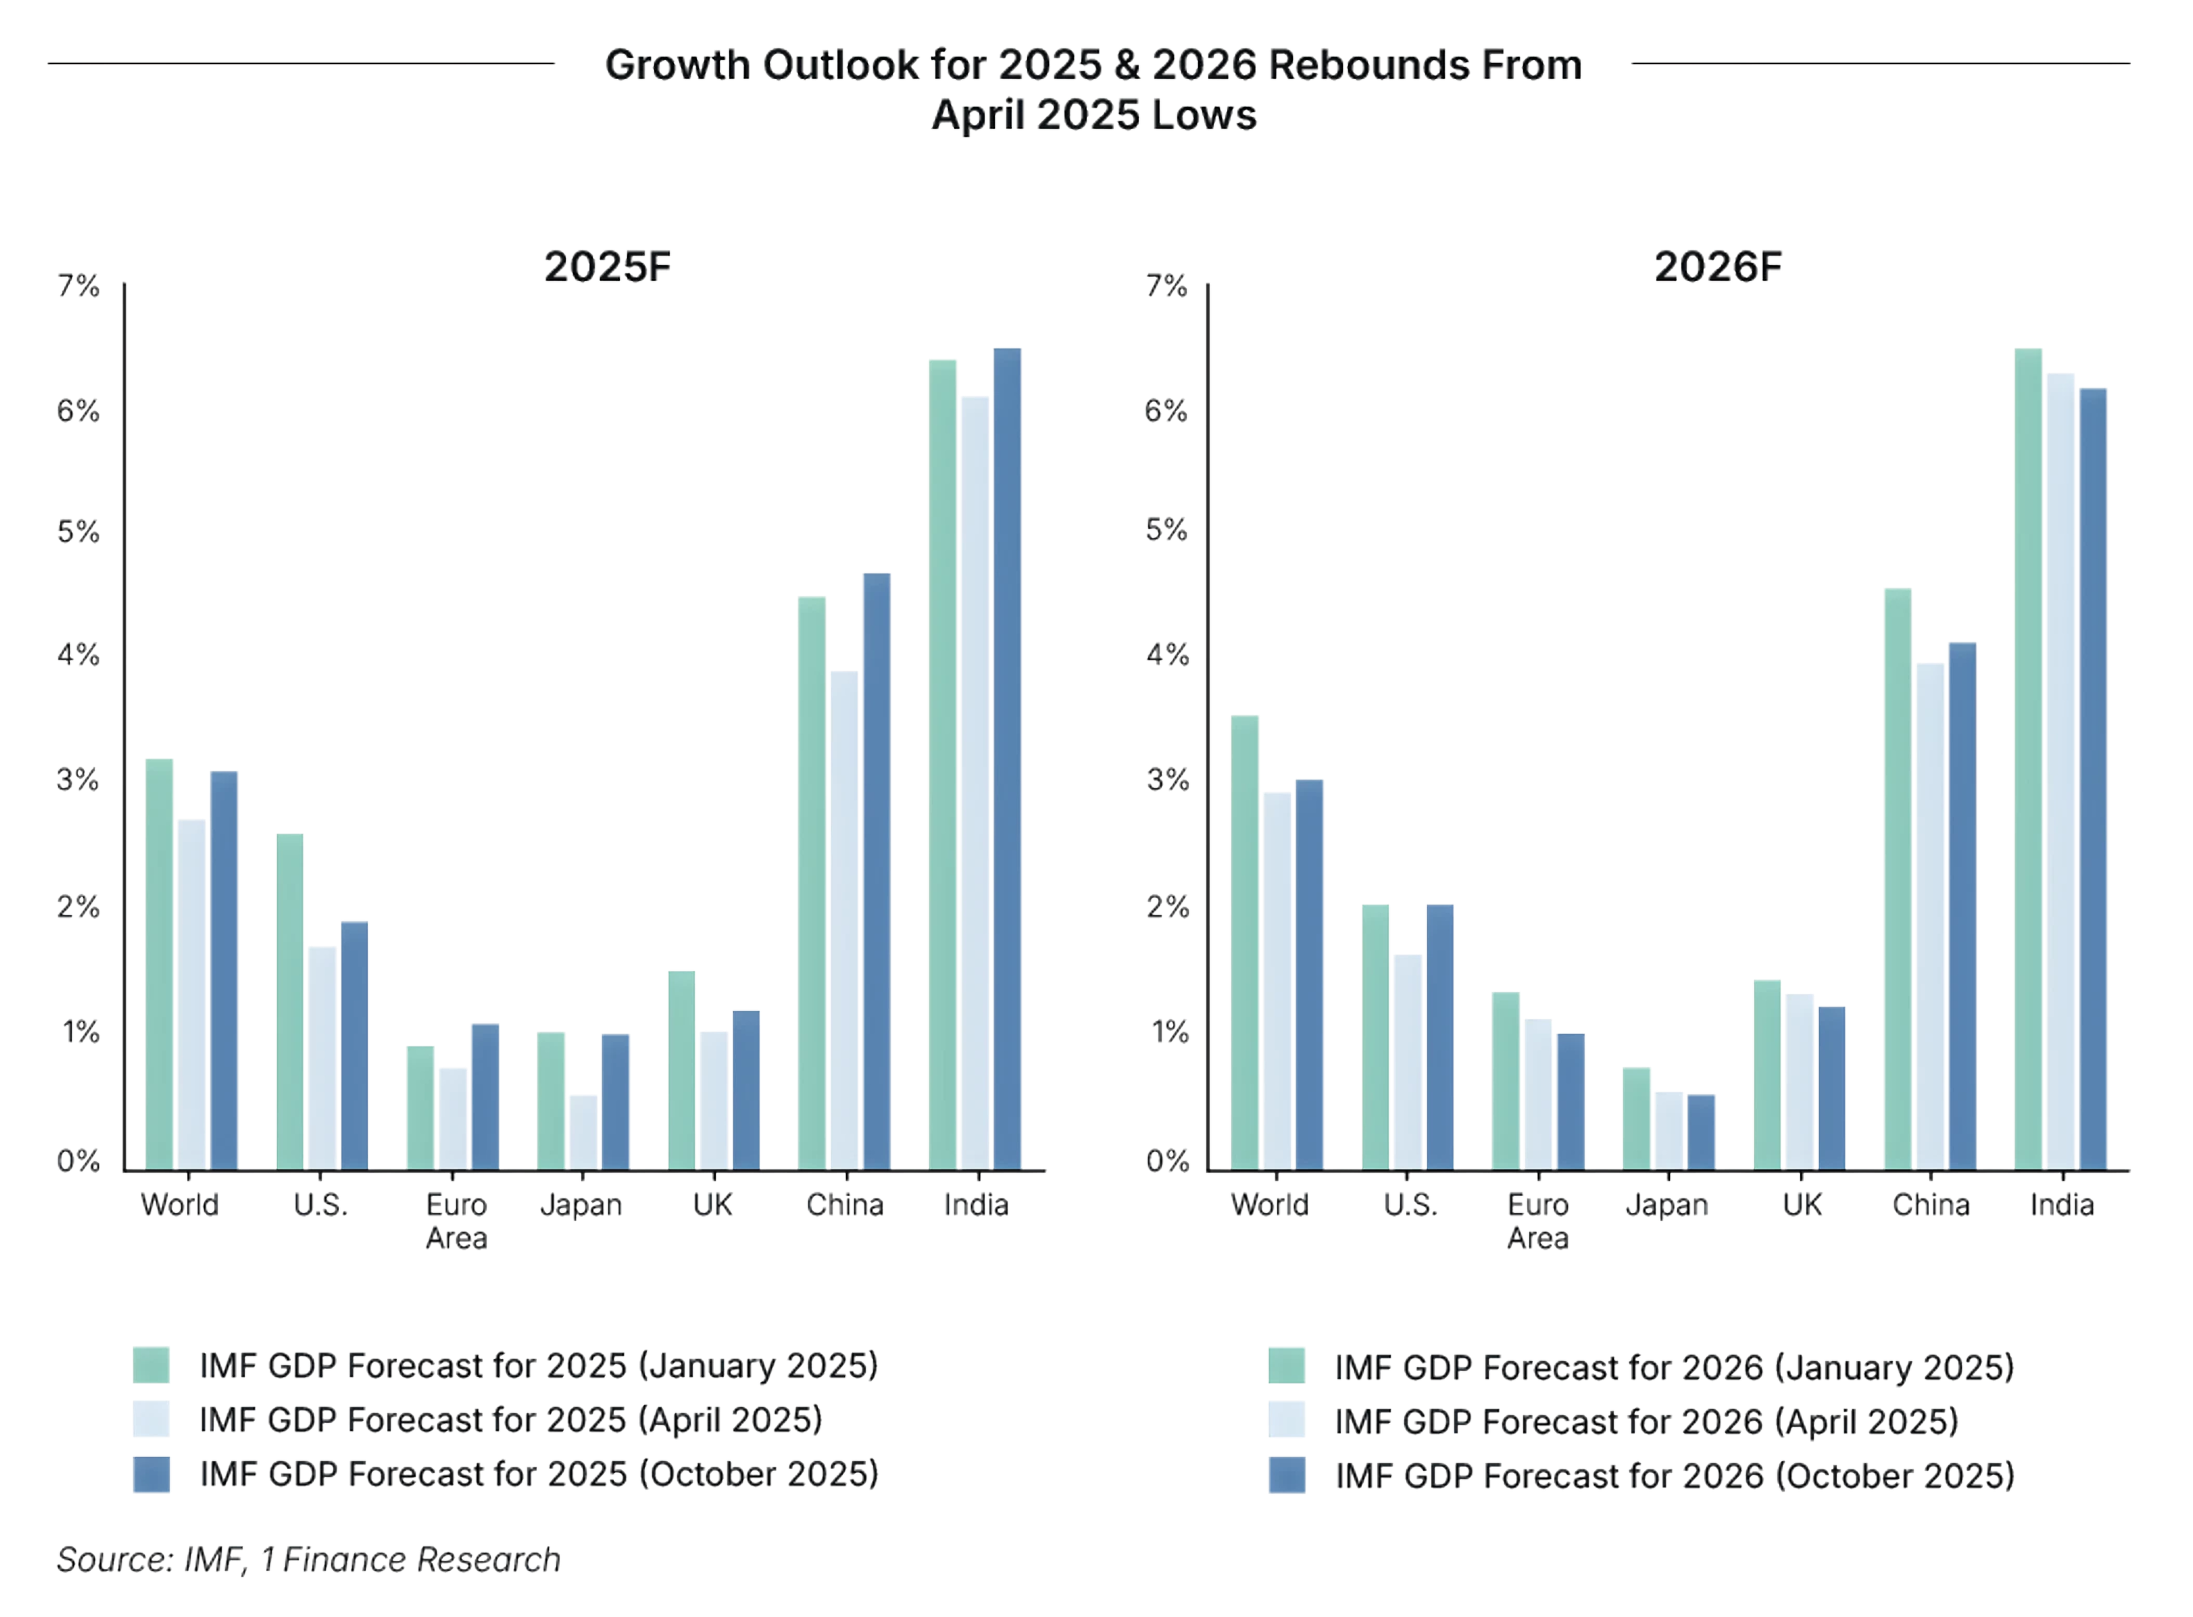
We forecast a 60% probability that India remains in the Strong Recovery phase in 2026. GDP is projected at 7.5% in 2025 and 6.7% in 2026. Sustaining this recovery will require continued monetary support, nominal GDP growth trending toward 11-12%, export stabilisation, and a gradual revival in private manufacturing capex.
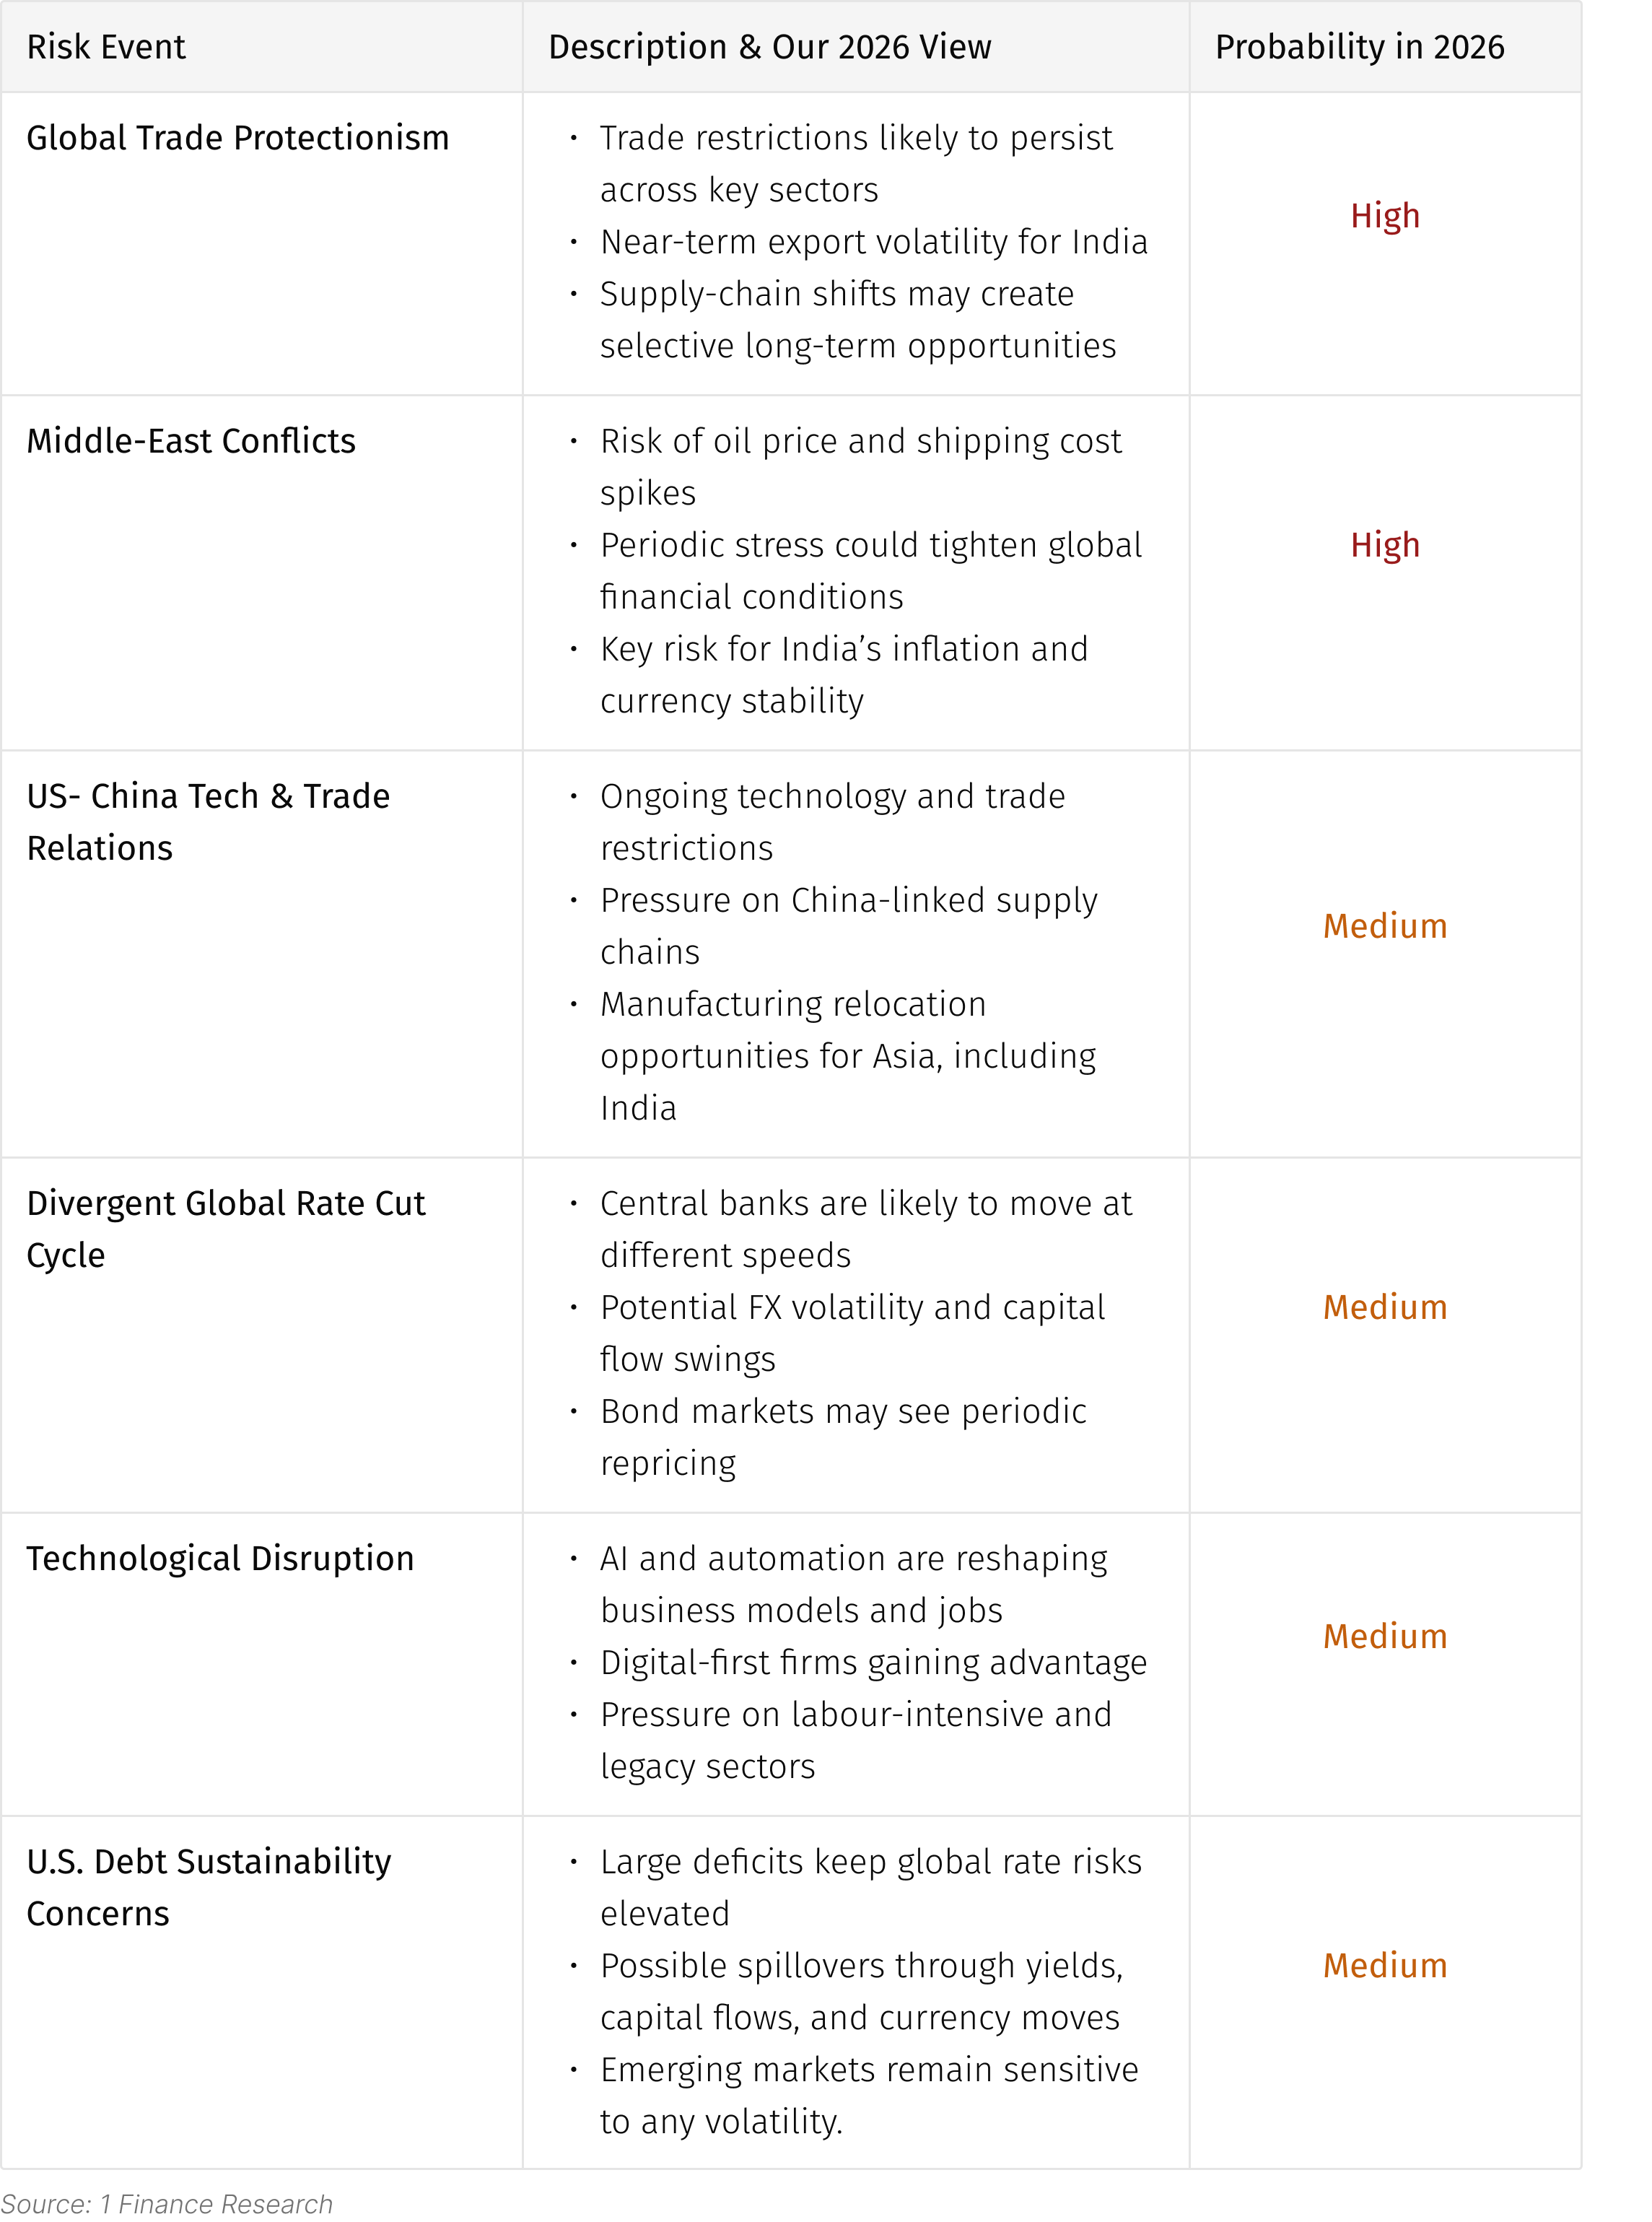
Taken together, the 2026 risk landscape argues against extreme positioning.
The dominant risks are global in origin, uneven in transmission, and more likely to influence relative returns rather than broad market direction. Portfolios built around leverage, narrow themes, or global trade sensitivity face greater stress. Maintaining diversification will remain important in navigating the uncertain global environment.
The gap between rural and urban inflation seen in 2025 is also likely to narrow as food-related softness fades and broader price trends normalise.
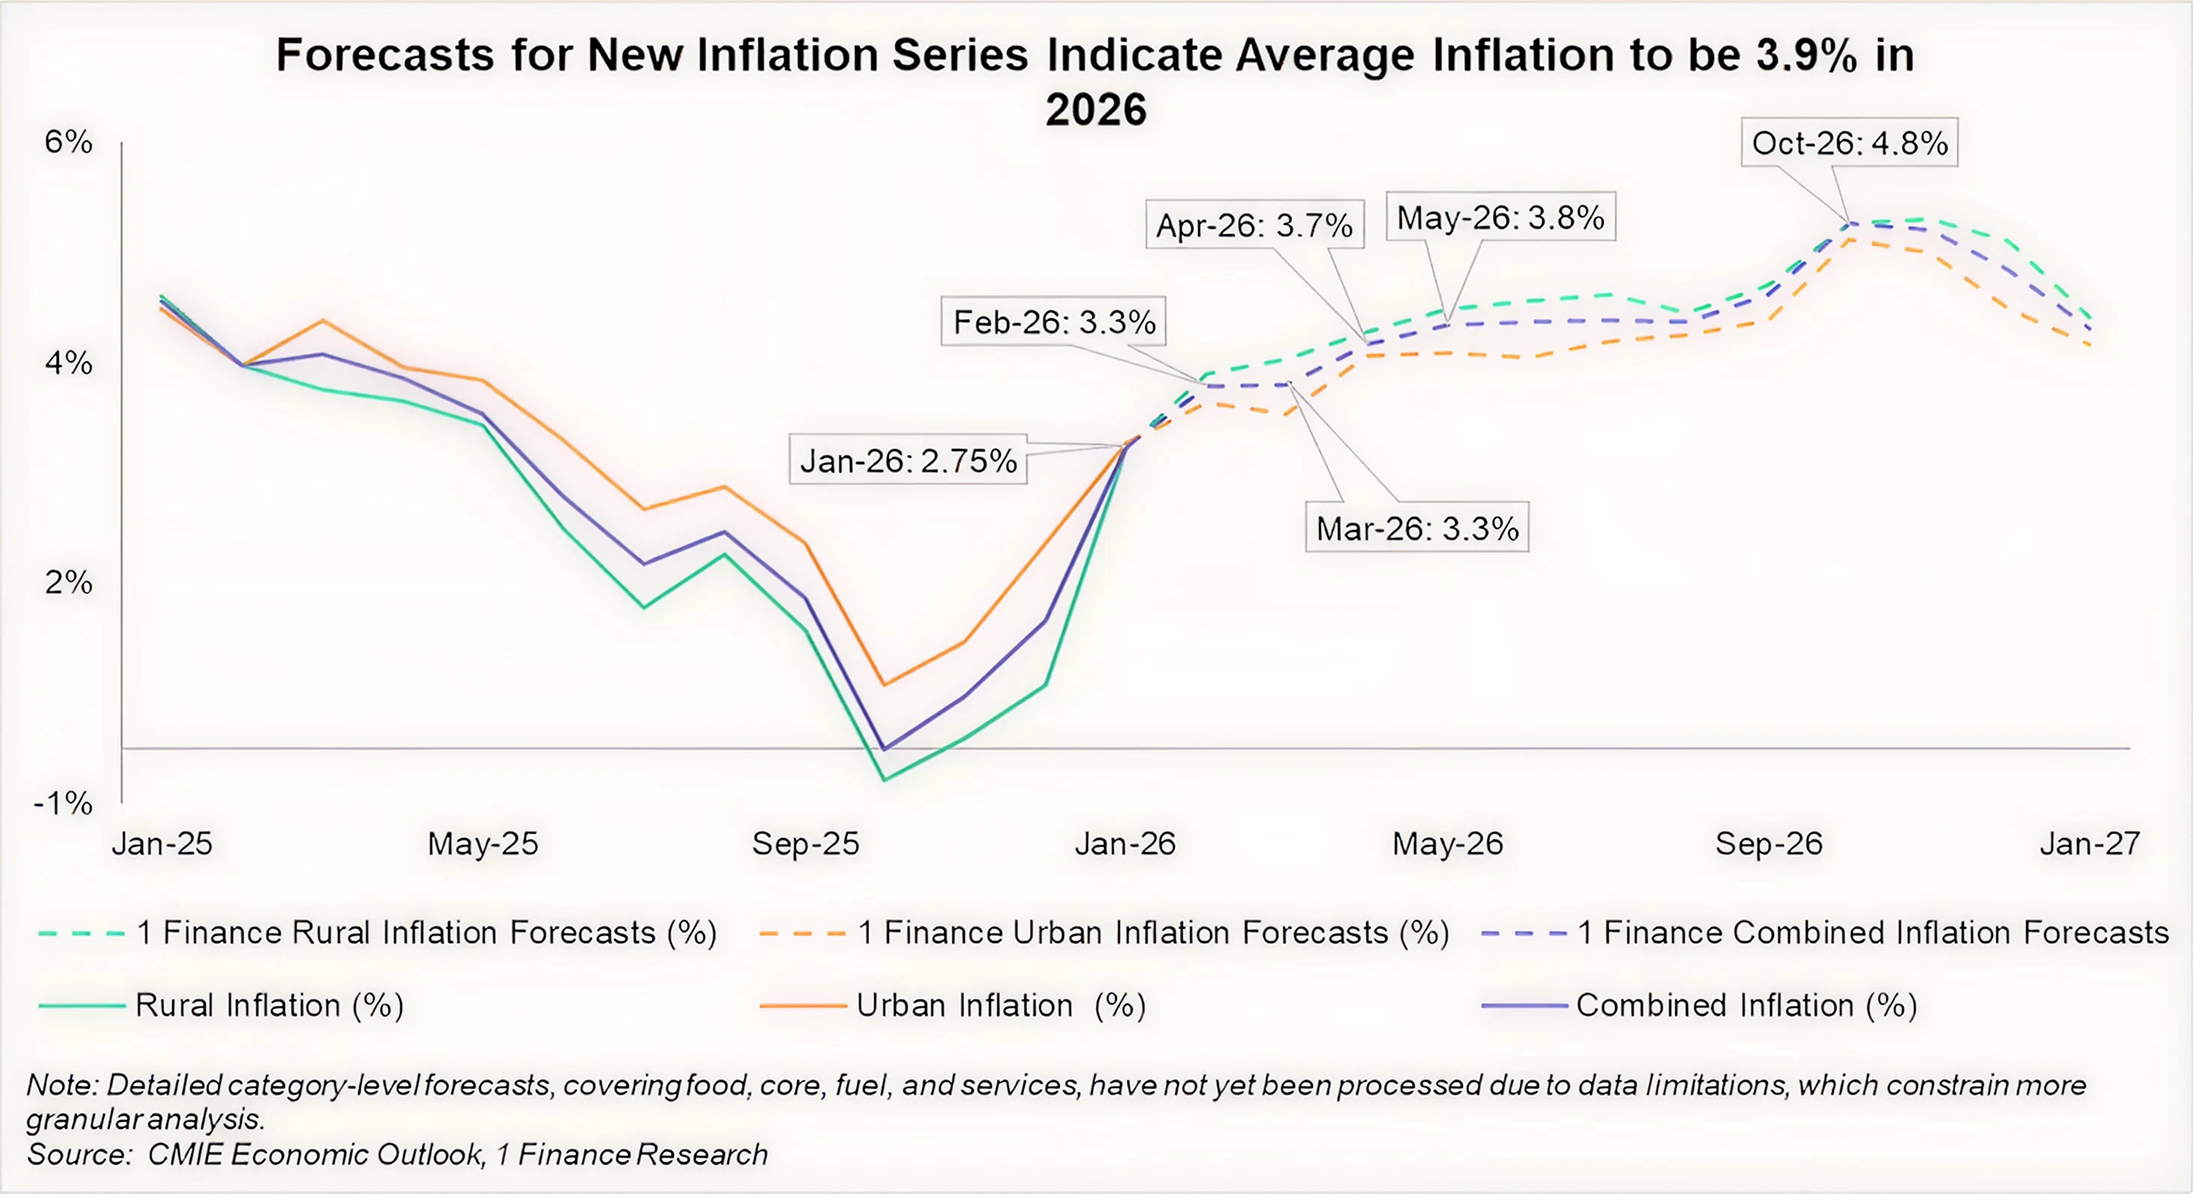
Even with this gradual rise, inflation is expected to remain around the RBI’s comfort zone for most of the year. This gives the central bank room to support growth.
Under our Taylor Rule framework, we see scope for 25-75 bps rate cuts by the end of 2026, conditional on a normal monsoon that keeps the food inflation in control and stable global crude oil prices, thereby limiting imported inflation and excessive rupee depreciation.
| Scenario | Probability | Favourable Triggers |
|---|---|---|
| No rate cuts (Repo: 5.25%) | 5% | If the inflation spikes suddenly, the INR depreciates, restricting the RBI's moves. Unlikely. |
| Modest easing: 25 bps (Repo: 5%) | 20% | Inflation reaches the 4% target. Domestic growth remains strong, and the RBI prefers to preserve policy space. |
| Base Case: 50 bps (Repo: 4.75%) | 40% | Base case scenario. Most likely. Inflation remains benign, and the domestic and external conditions remain stable |
| Deep easing: 75 bps (Repo: 4.5%) | 30% | Inflation persists below 3%. Global growth slows down, and domestic demand signals also appear weak |
| Aggressive easing: 100 bps (Repo: 4.25%) | 5% | Exceptional downside: Domestic growth drops, deflation persists or a major global shock forces a massive easing |
Source: 1 Finance Research
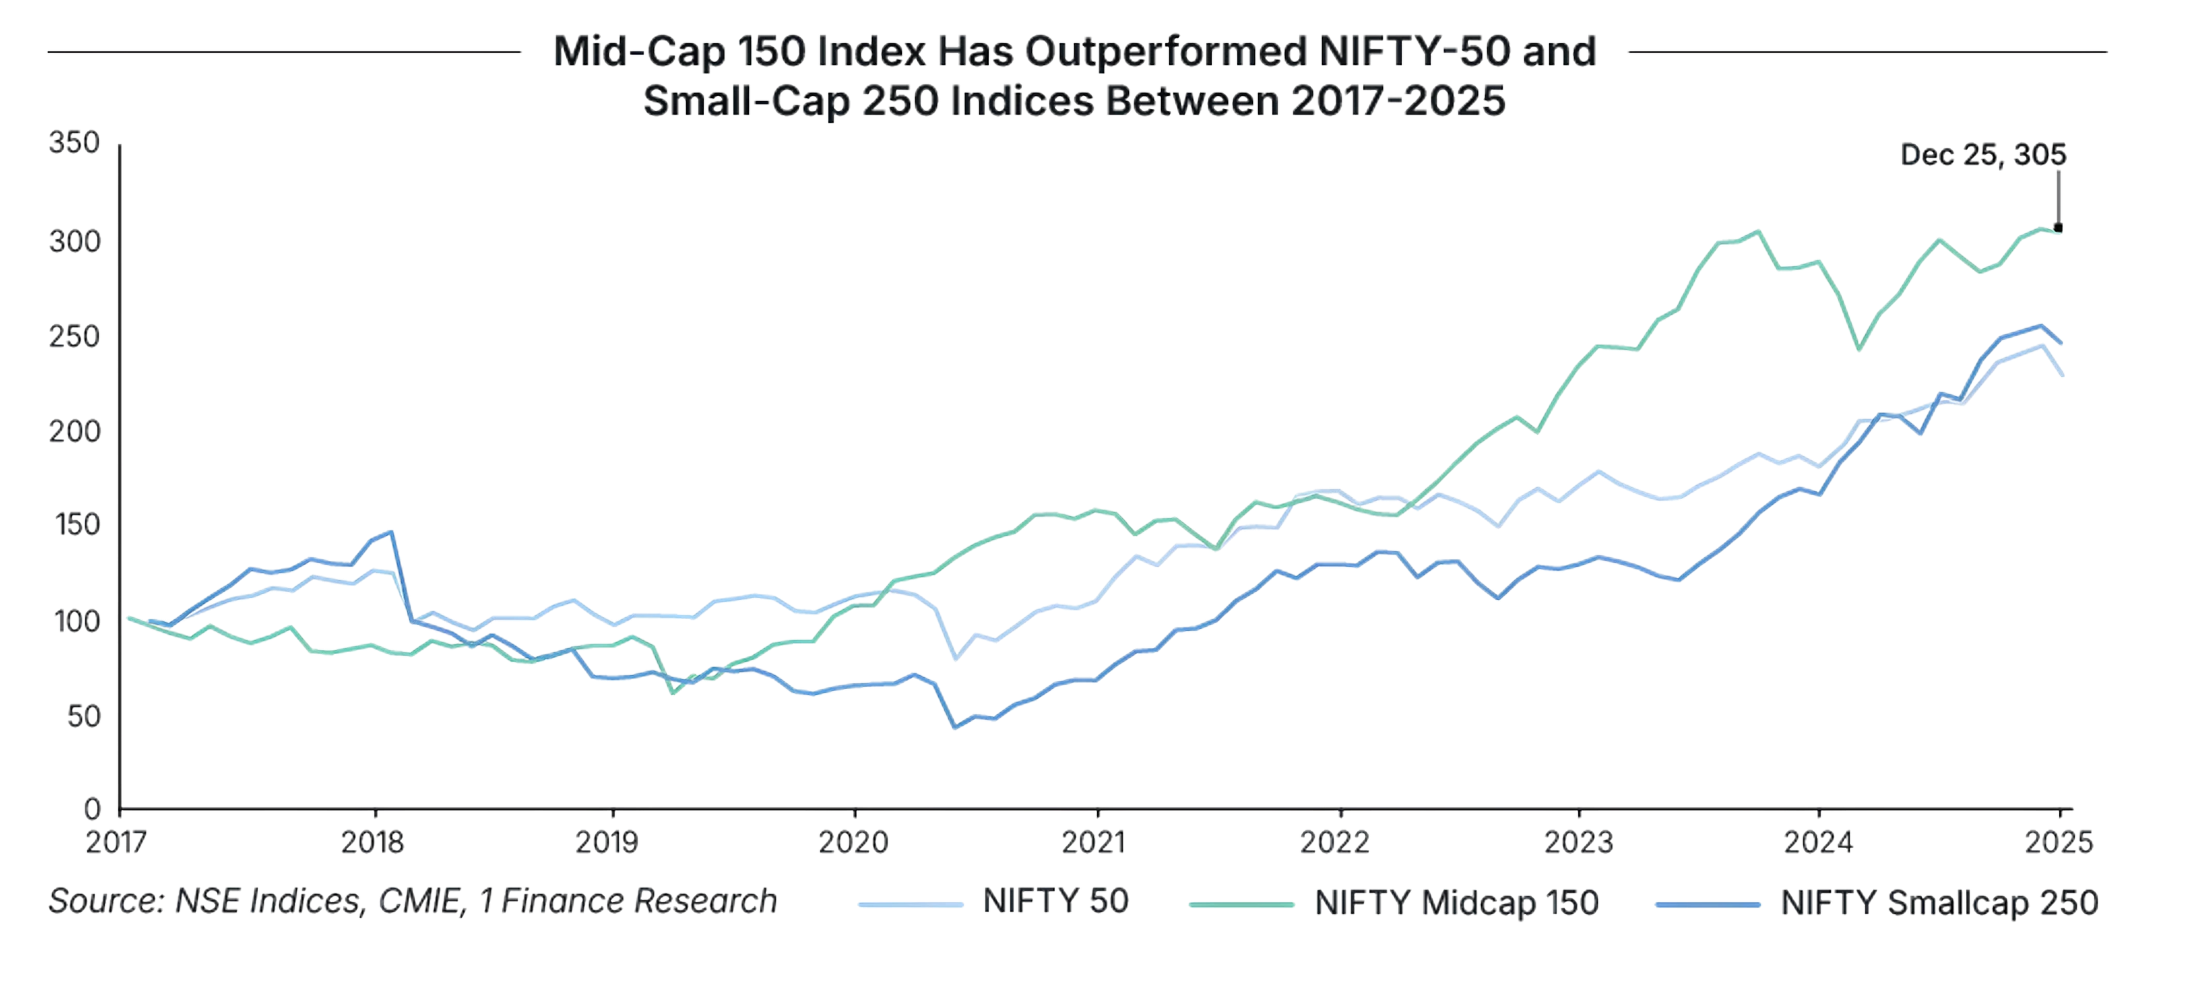
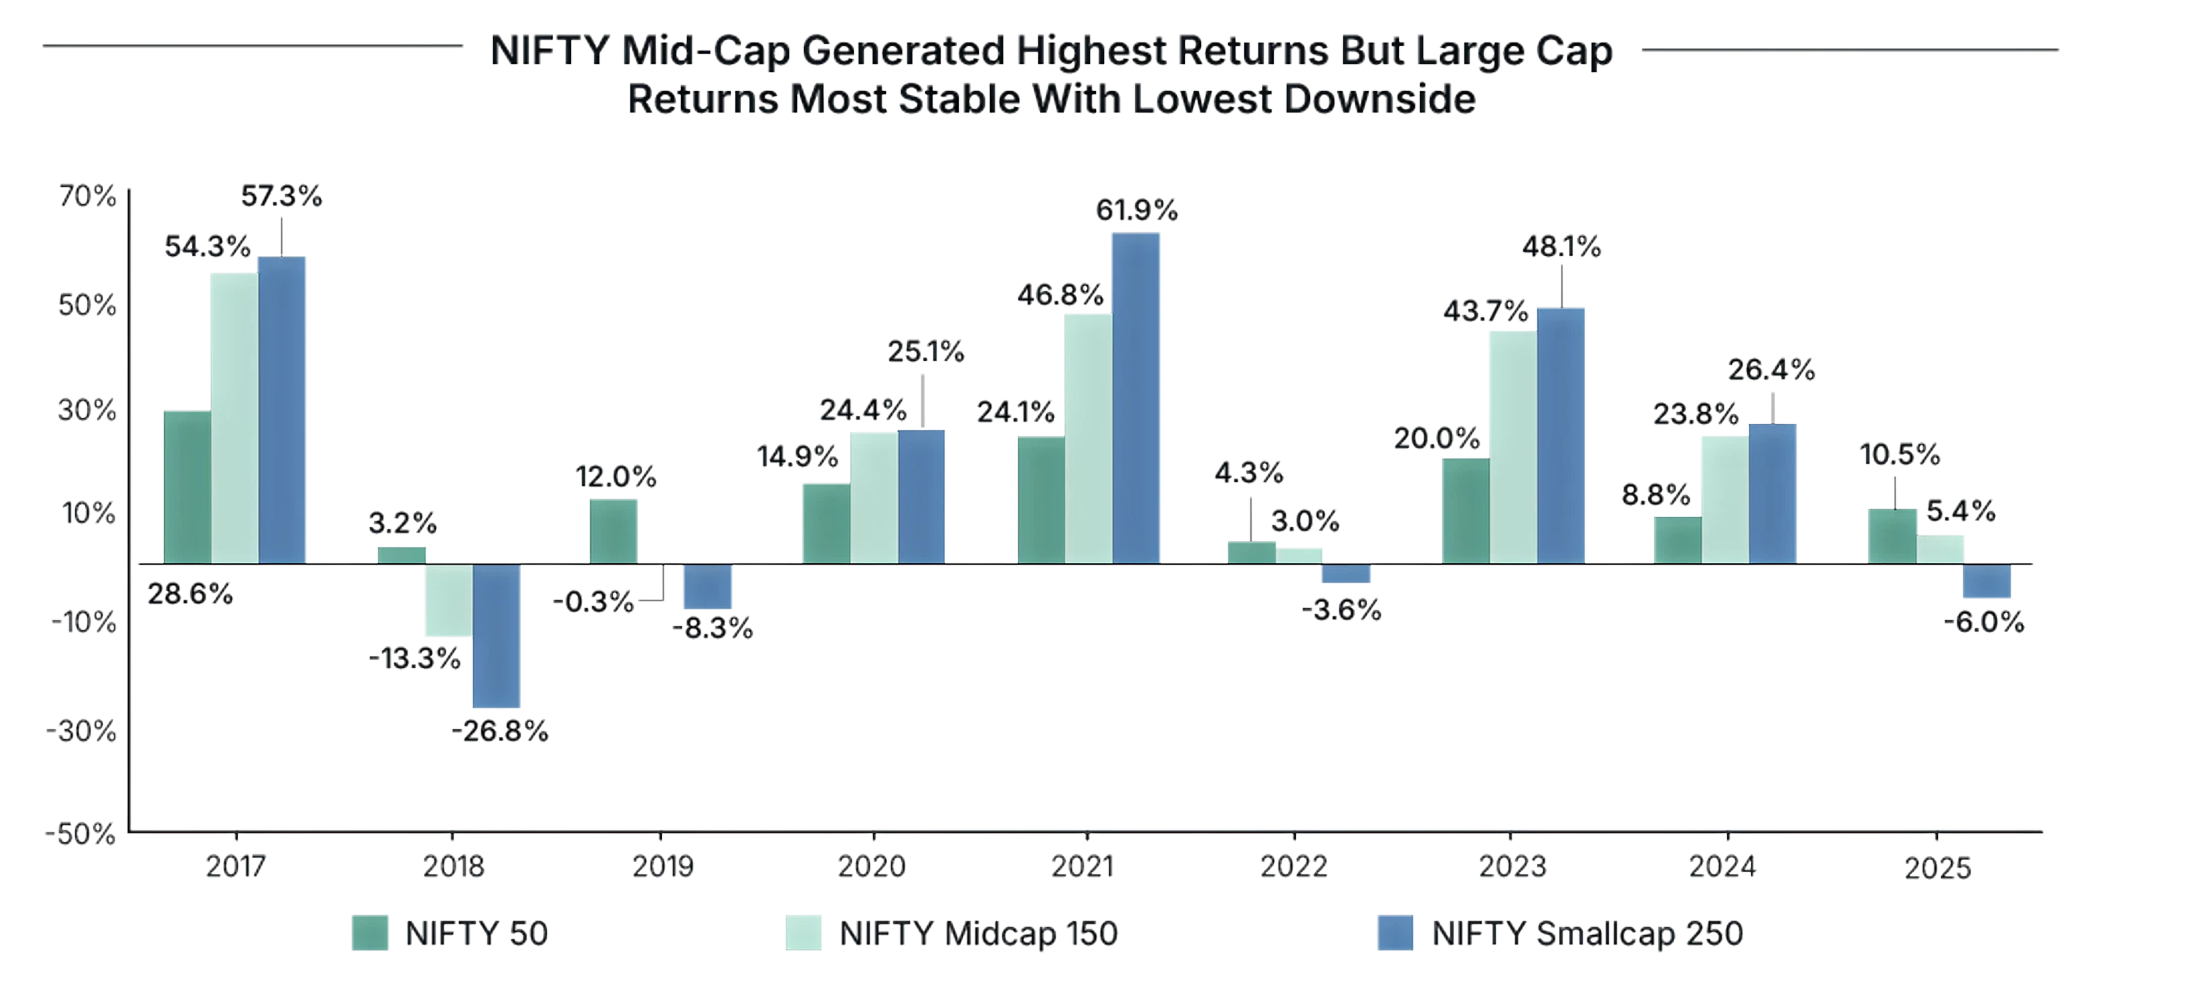
Over the medium term, between 2017 and 2025, the NIFTY MidCap-150 has delivered the highest annualised return at 14.9%, reflecting stronger growth, although with higher volatility.
In 2025, Metals led sectoral performance, followed by Autos, Financial Services and Banks, supported by strong domestic demand, infrastructure spending, and a favourable credit environment.
| Sector | Outlook for 2026 | Key Macroeconomic Drivers in 2026 |
|---|---|---|
| Auto | Positive | Rural demand recovery and improved affordability supported by rate cuts and tax relief. |
| Banking and Financial Services | Positive | Lower interest rates to support credit growth, stable asset quality and improving loan demand. |
| Infrastructure | Positive | Government-driven capital expenditure towards urbanisation and housing. |
| FMCG | Positive | Rural recovery and easing inflation to support volume growth and margins. |
| Metals | Neutral | Strong domestic demand, but global price volatility may limit upside. |
| Pharma | Neutral | Stable domestic demand offset by export pricing and regulatory risks. |
| Oil & Gas | Negative | Policy uncertainty and crude price volatility despite steady domestic demand. |
| Information Technology | Negative | Weak global demand and limited AI leadership in India versus global peers. |
| Media | Negative | Weak global demand and slower growth in outsourcing and tech spending. |
Source: CMIE, Moneycontrol, 1 Finance Research
India enters 2026 with a favourable macro backdrop of strong growth, easing inflation, and stable policy conditions. As FII flows return, large caps are likely to benefit the most, given their earnings visibility, stronger balance sheets, and relative resilience in a volatile global environment.
The next phase of the cycle is expected to be more selective. Infrastructure-linked micro-markets with improving connectivity and visible execution are likely to see stronger demand and pricing power, while saturated or poorly connected locations may face slower absorption. Developer credibility, project scale, and delivery track record are also becoming more important as buyers turn more cautious and value-focused.
At the same time, expected rate cuts and improving affordability should support end-user demand, particularly in mid-income and first-time buyer segments. Overall, the housing cycle is shifting from momentum-driven growth to a more stable, location- and quality-led phase.
Routine tech roles face displacement, yet the net employment effect should prove positive as higher-value positions emerge. Global Capability Centres already pay 12-20% more than traditional IT firms, and AI/ML specialists earn 30-50% wage premiums.
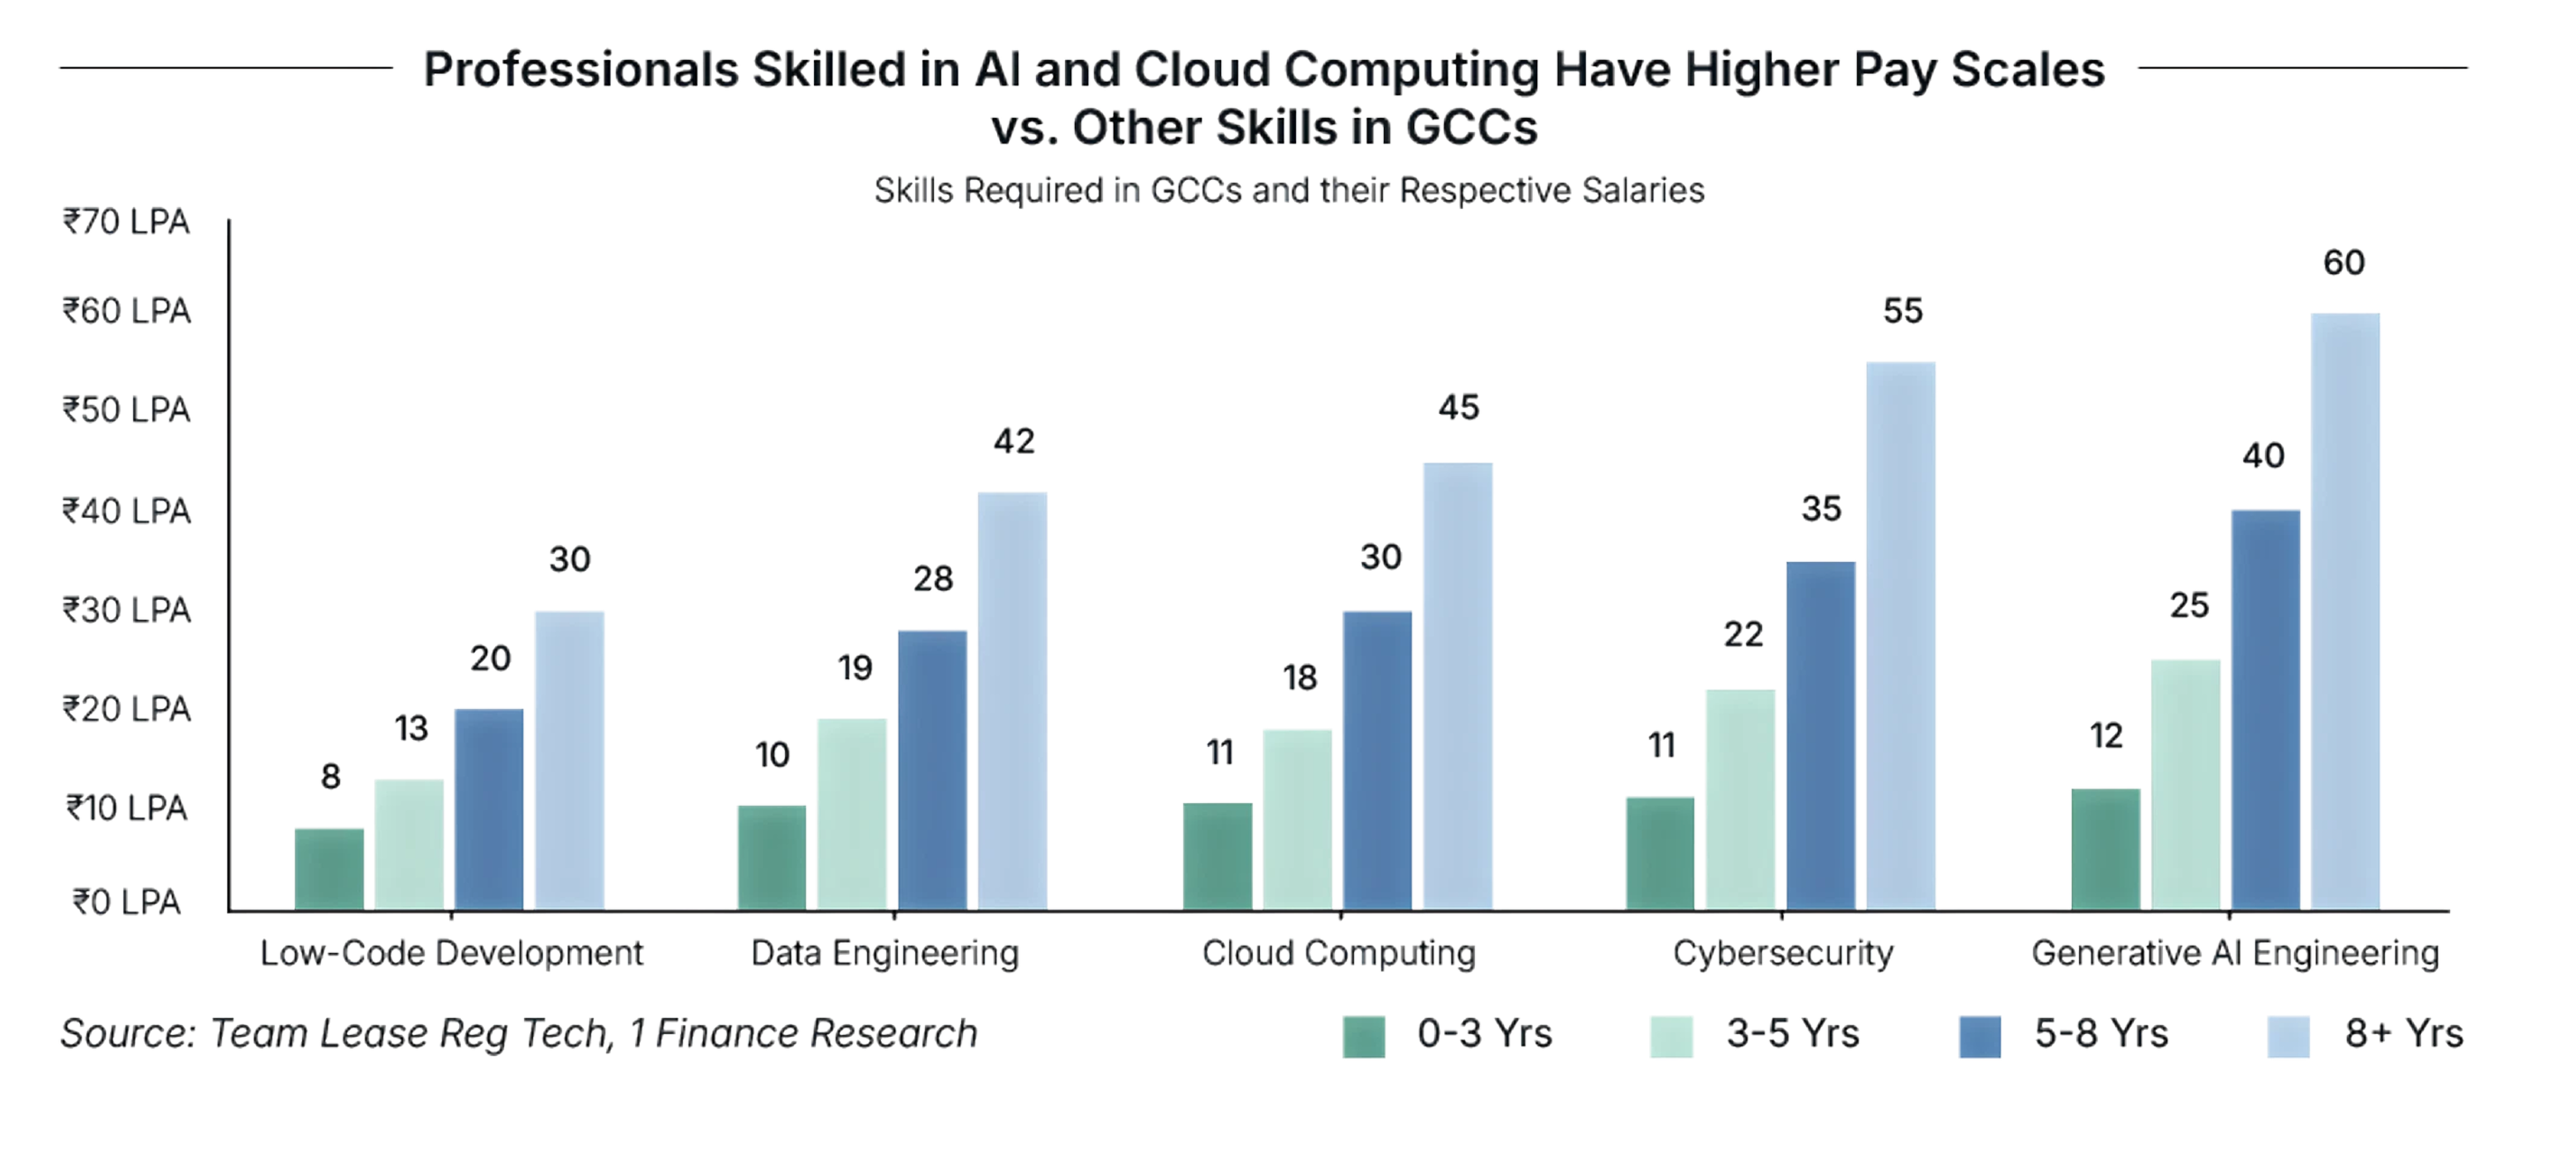
Productivity and earnings gains will accrue to AI-enabled firms and skilled talent. India's results will turn on the depth of skills and quality of execution, beyond mere adoption.
Against this backdrop, 2025 became a year of broad-based monetary easing, with major central banks cutting rates to cushion downside risks. However, with growth stabilising and inflation no longer collapsing, the case for continued aggressive easing in 2026 is weakening. Several central banks are expected to slow the pace of cuts, and some may pause altogether. The table below summarises rate expectations for major economies by the end of 2026:
| Central Bank | 2025 Policy Move | Outlook for 2026 |
|---|---|---|
| US Federal Reserve | 75 bps of rate cuts | Gradual Easing |
| European Central Bank | 100 bps of rate cuts | Extended Pause |
| Bank of England | 100 bps of rate cuts | Gradual Easing |
| Bank of Japan | 50 bps of rate hikes | Gradual Tightening |
| Reserve Bank of India | 125 bps of rate cuts | Gradual Easing |
| People's Bank of China | 10 bps of rate cuts | Small Rate Cuts, Targeted Easing |
Source: 1 Finance Research
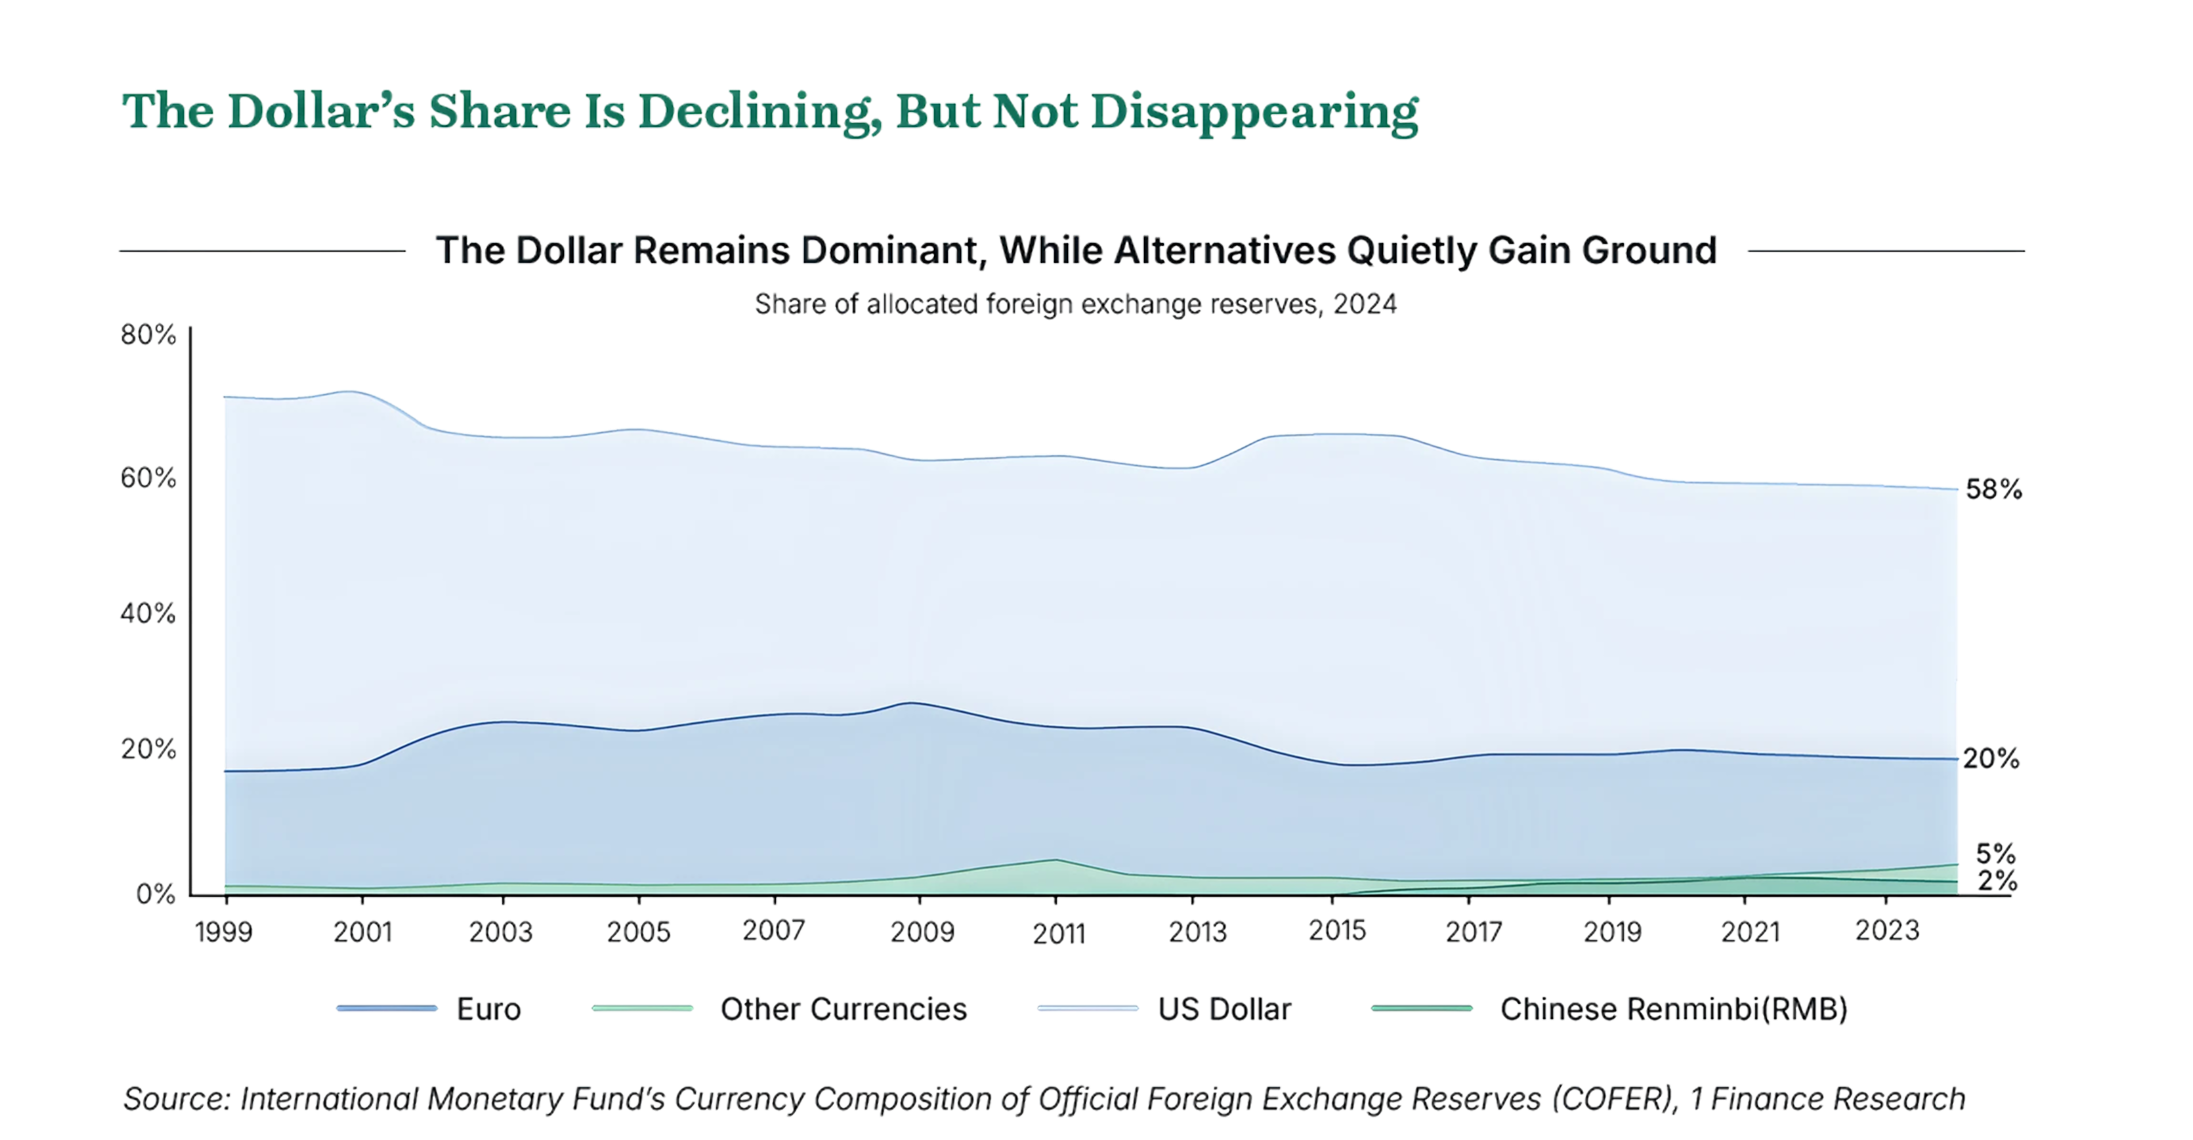
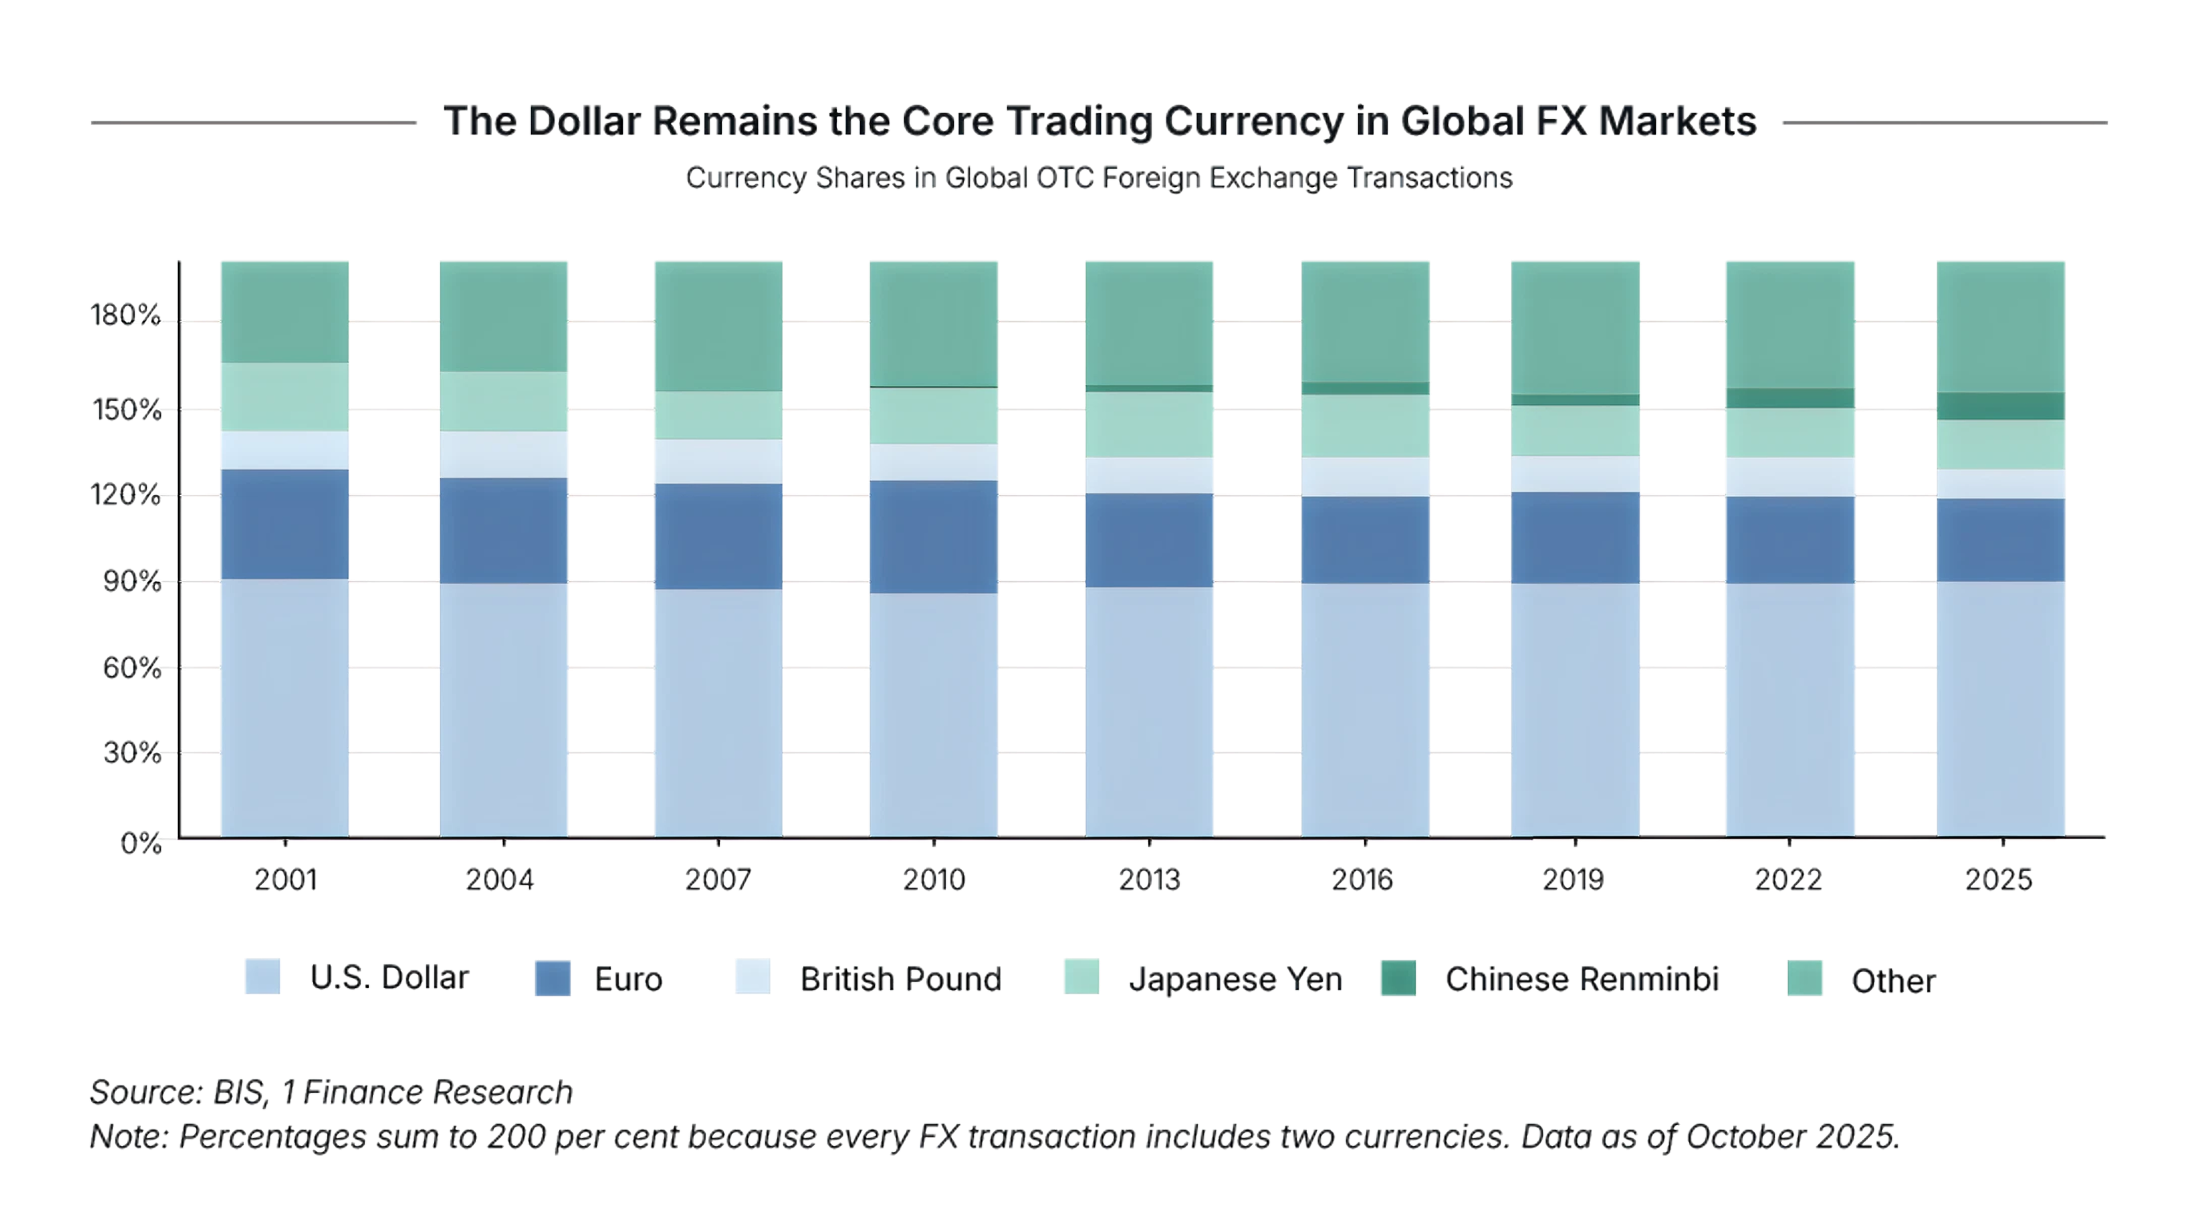
However, despite these shifts, the dollar’s share of global reserves, trade invoicing, and financial transactions remains significantly higher than any alternative. The scale, liquidity, and institutional depth of U.S. financial markets continue to anchor its global role. Overall, diversification is likely to continue gradually, but no currency currently has the scale to meaningfully challenge the dollar’s dominance in 2026.
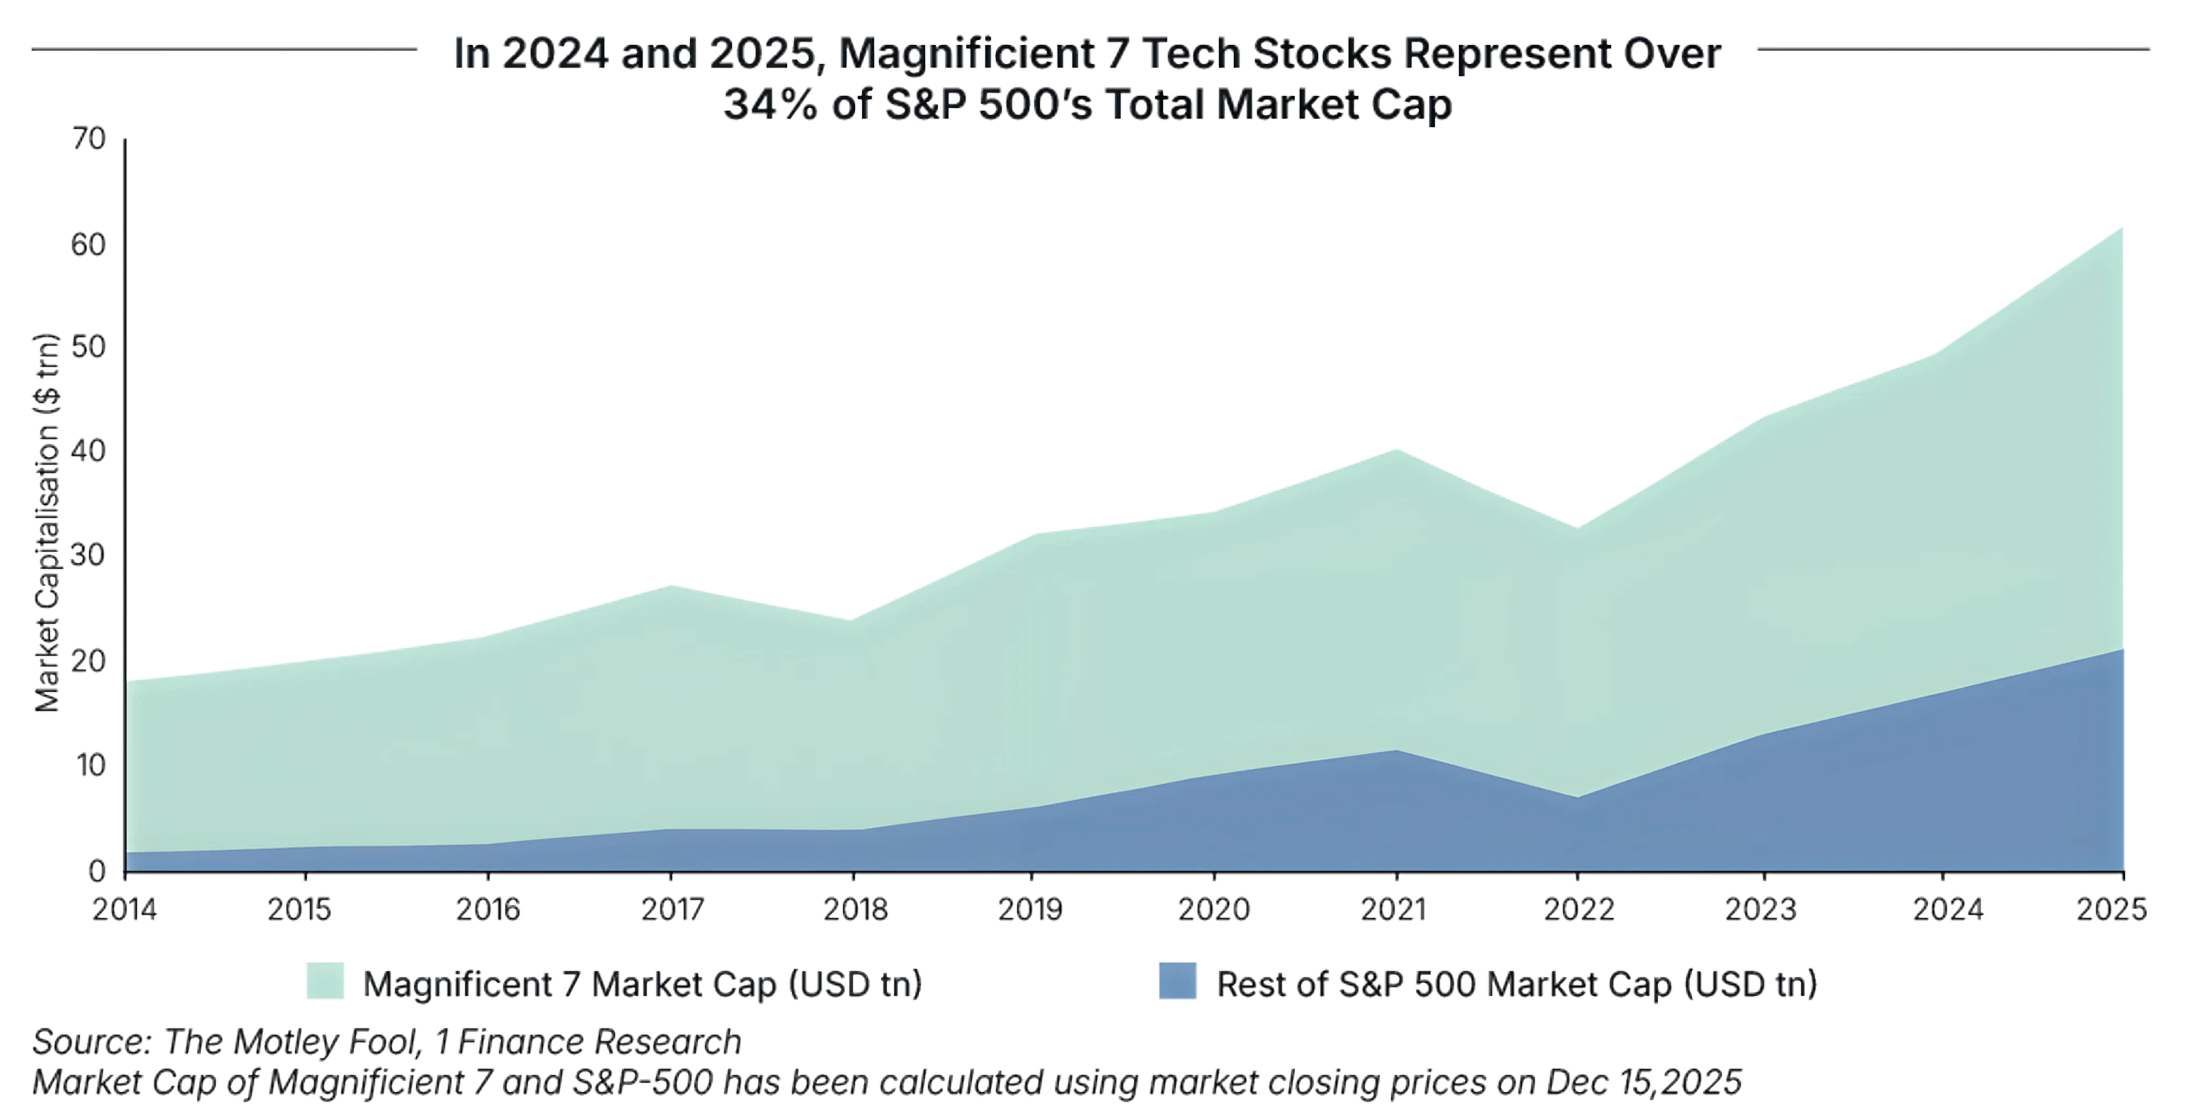
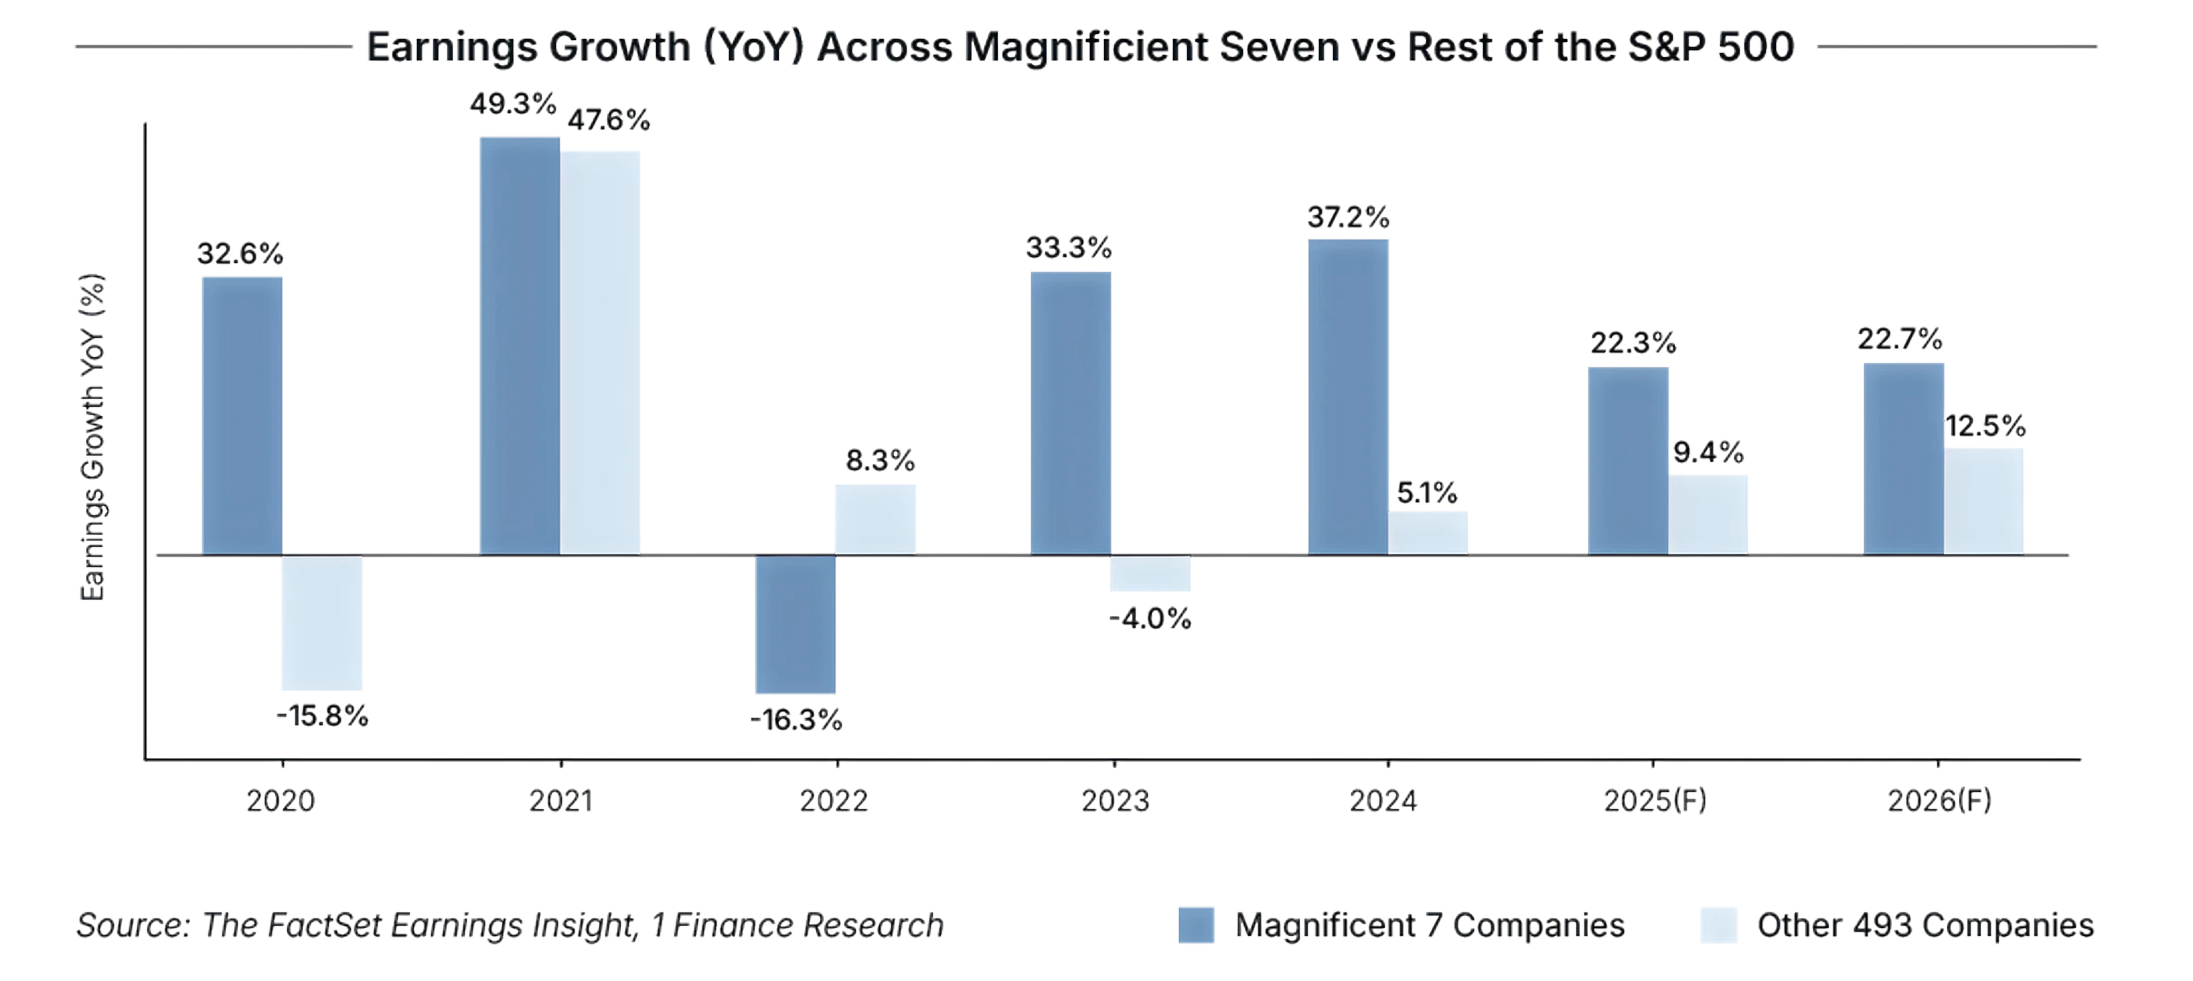
Together, they account for ~34% of the S&P 500’s market capitalisation in 2025. In summary, this narrow group has accounted for nearly 75% of index returns, about 80% of aggregate earnings growth, and close to 90% of capital spending in recent years, highlighting the growing concentration risk.
If earnings slow for the Magnificent Seven, the broader index could suffer. Given their large share of S&P 500 profits, even small misses may pressure valuations and lift volatility.
High concentration ties portfolios to one growth story. Diversifying across regions, sectors and lower AI-heavy indices can reduce risk.
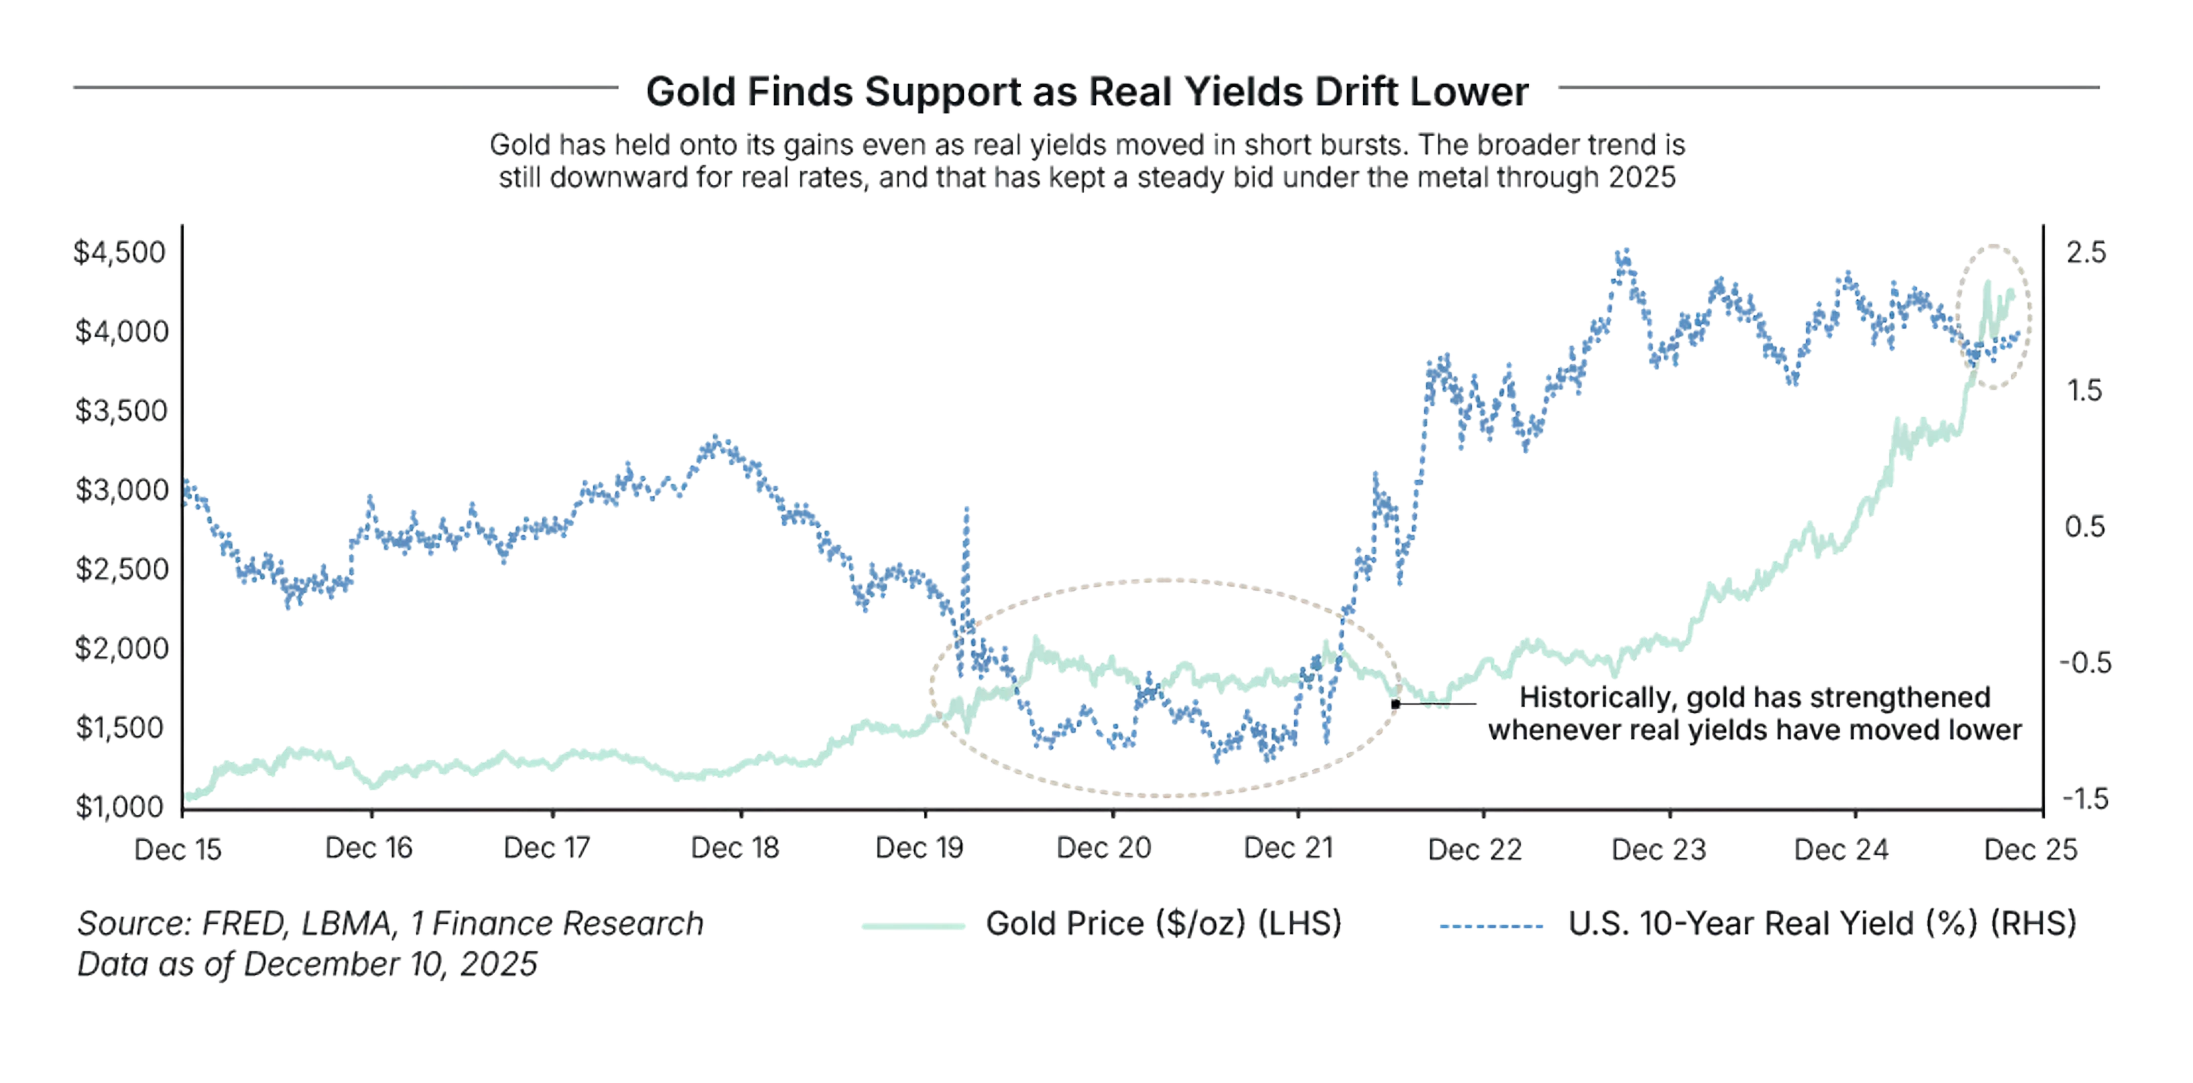
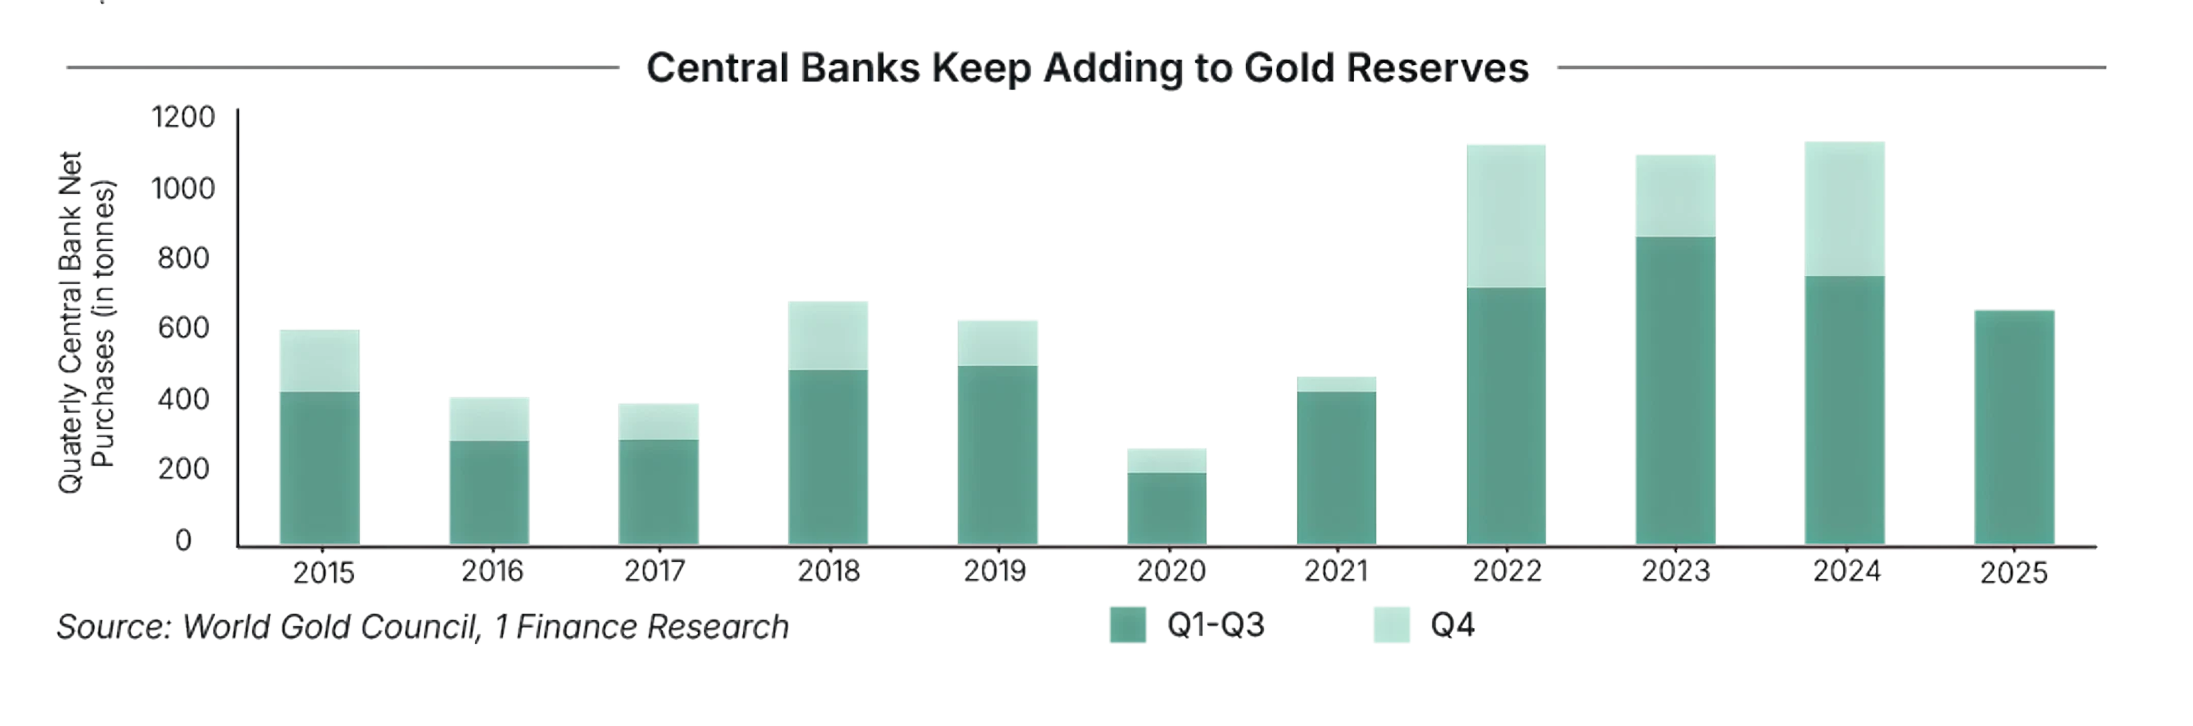
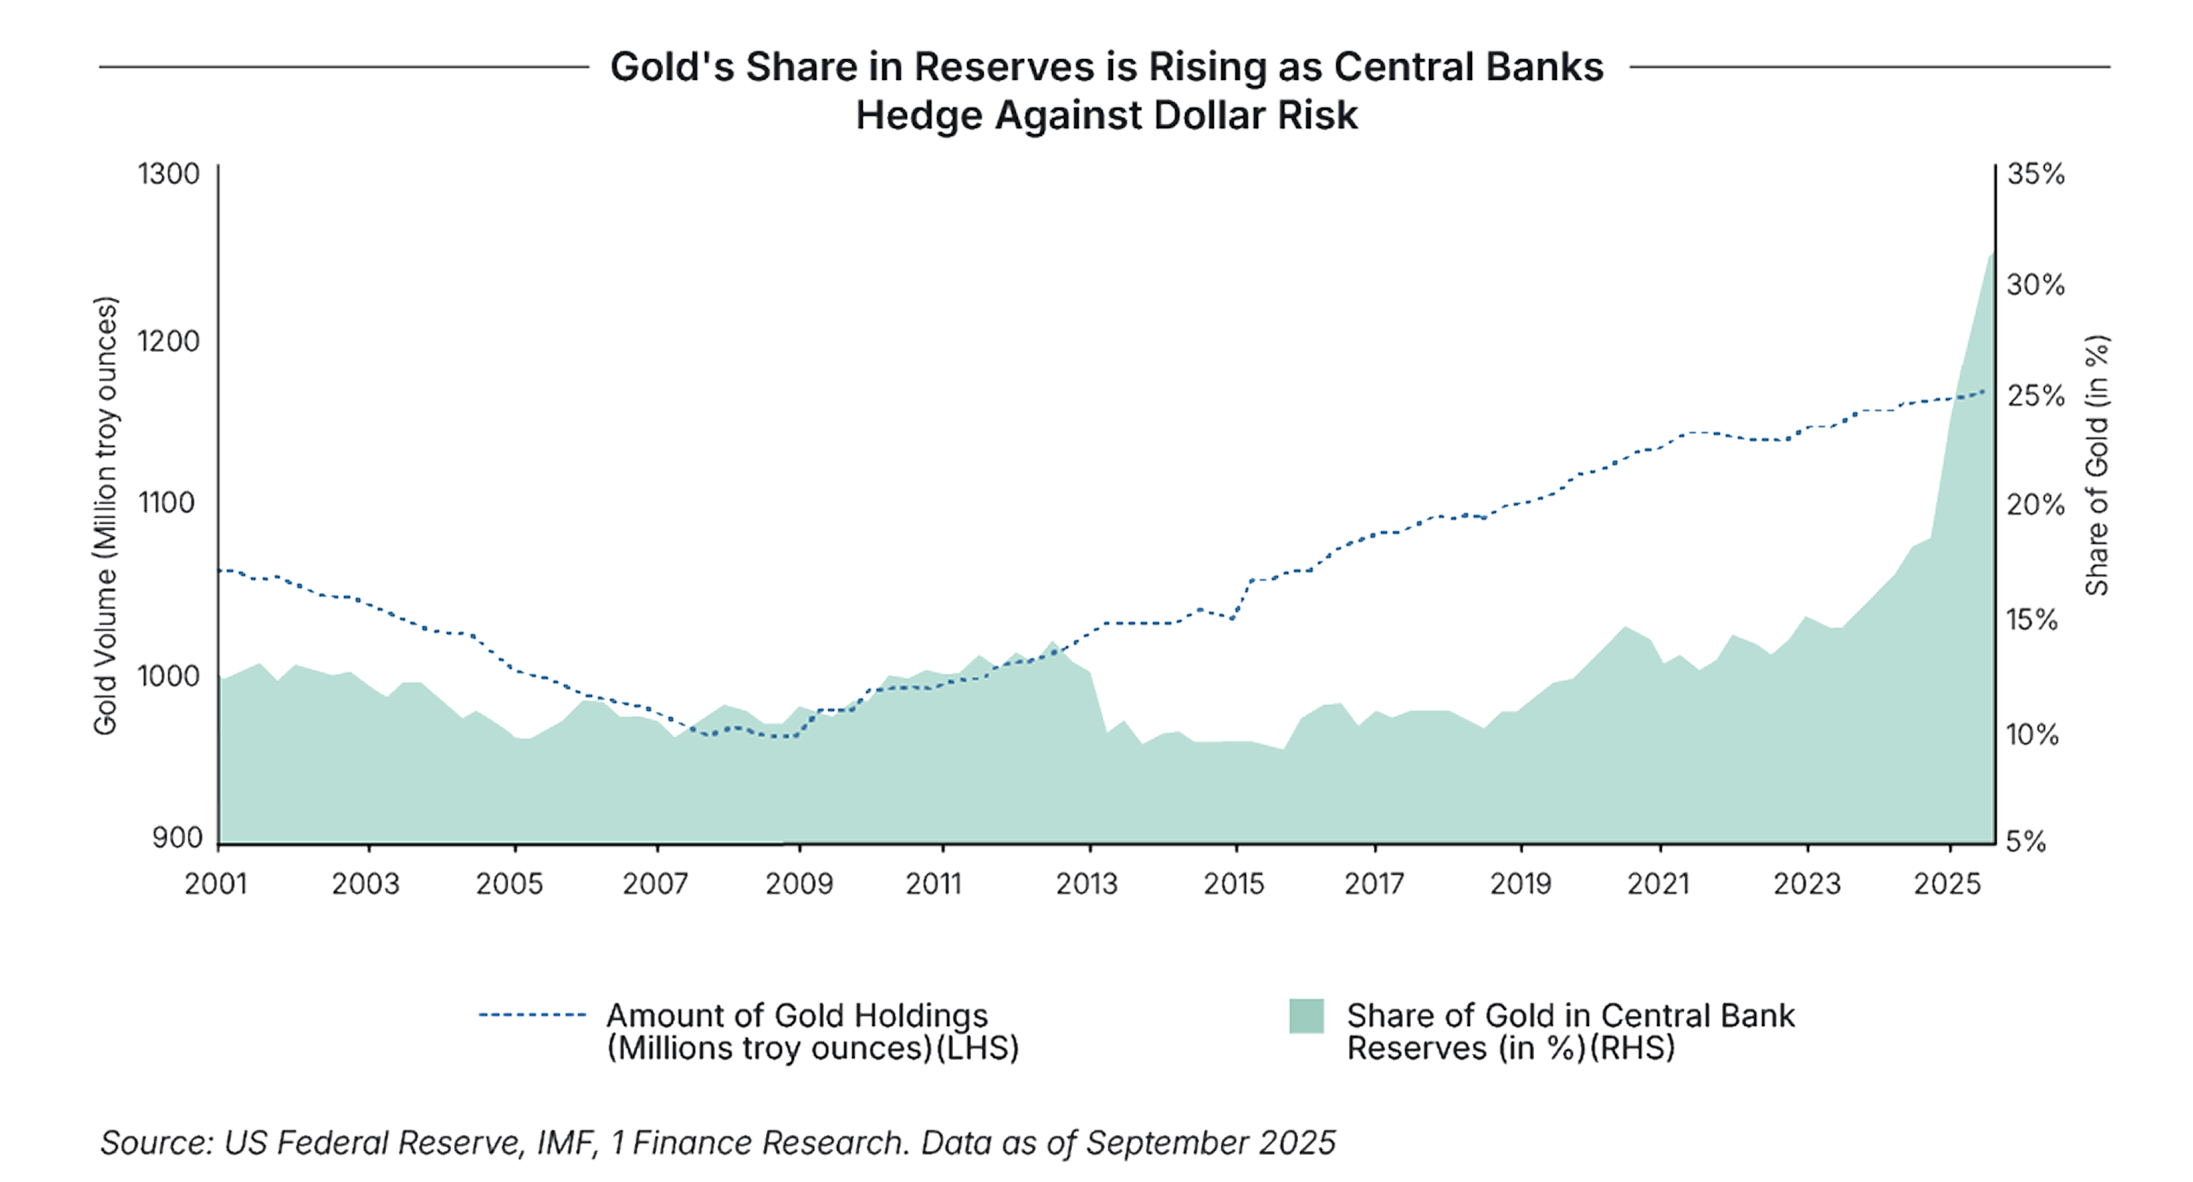
However, after the strong rally in recent years, investment demand may moderate as positioning becomes more cautious. Physical demand could also soften, with slower jewellery consumption in key markets. In addition, any stronger-than-expected U.S. dollar strength may limit upside by reducing the appeal of gold for global investors.
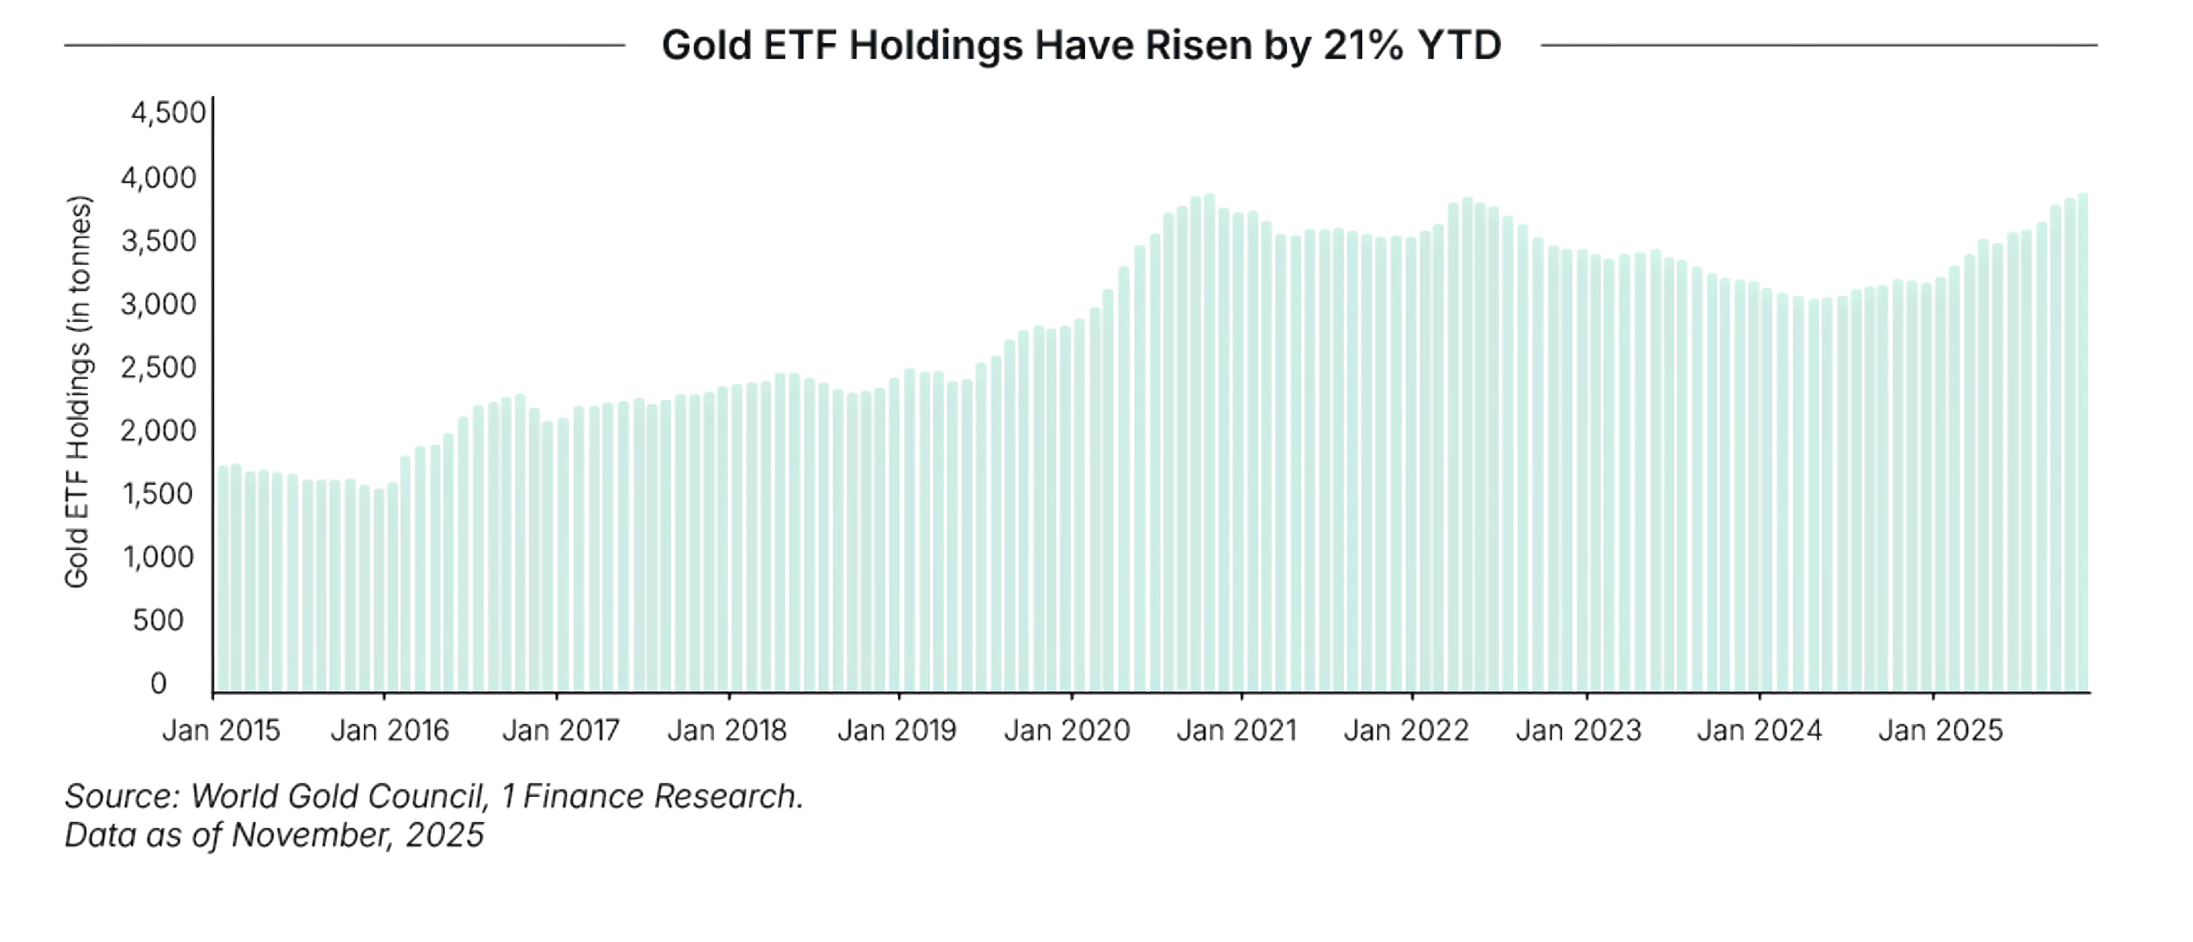
Overall, gold is likely to consolidate at elevated levels rather than extend its rally. The metal is expected to remain a portfolio hedge and stability asset, but return expectations for 2026 remain moderate.
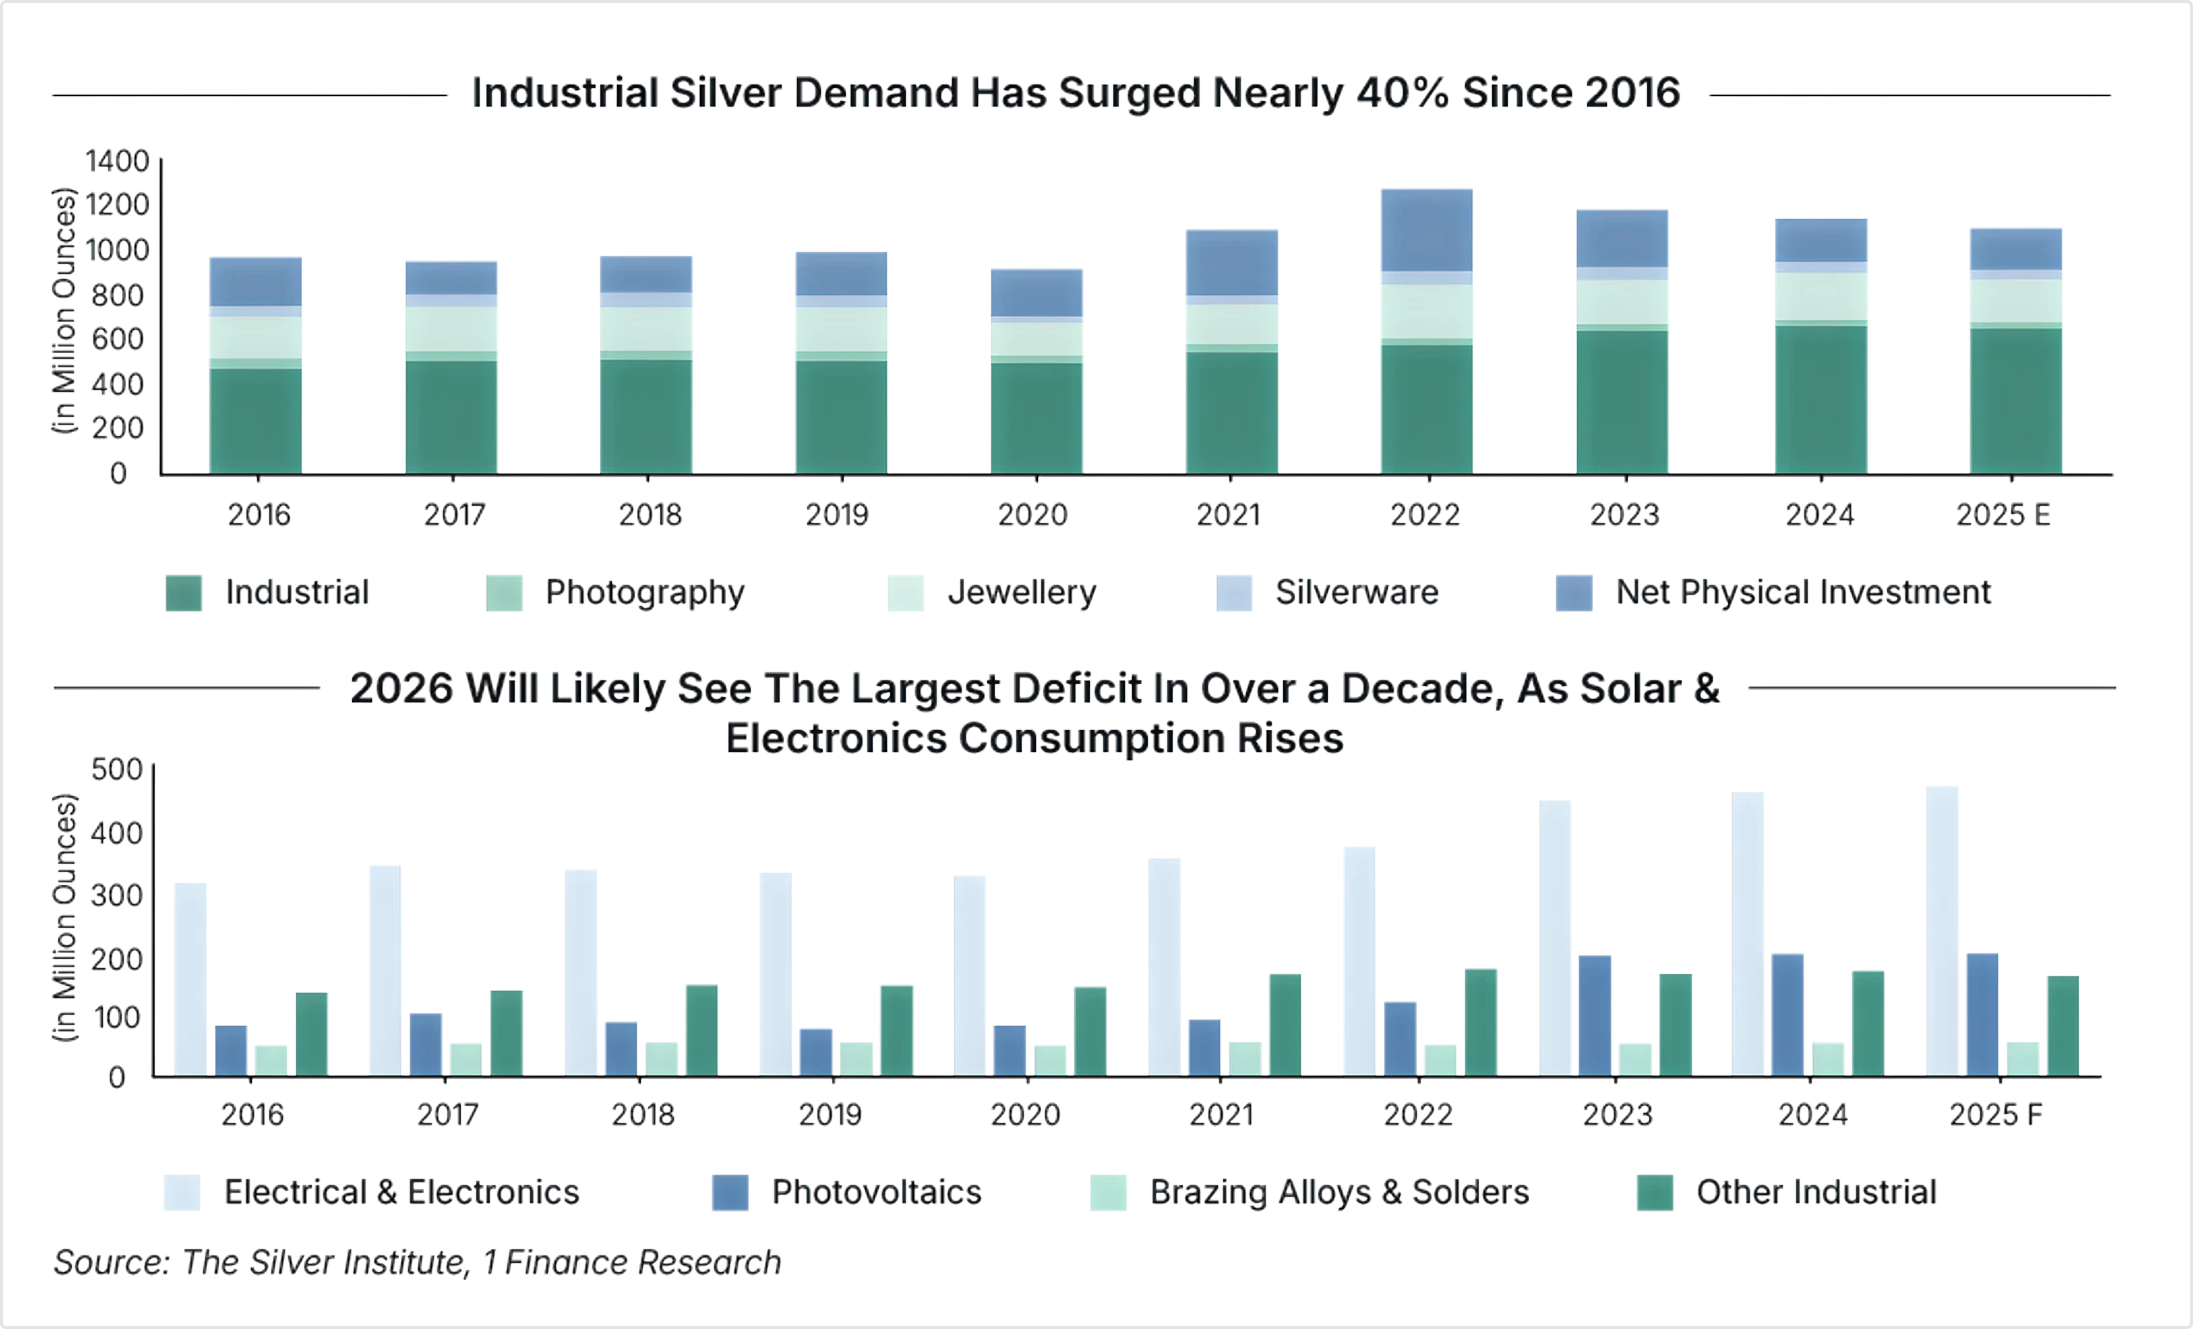
However, after a strong performance of 145% in the previous year, profit-taking and cautious investor positioning could limit fresh upside. A stronger-than-expected U.S. dollar may also weigh on investor demand. Overall, silver’s outlook remains neutral despite supportive long-term drivers.
Platinum, meanwhile, is better positioned within the precious metals segment. Ongoing supply deficits, low above-ground inventories, and increasing substitution demand from automakers replacing palladium are expected to tighten market conditions.
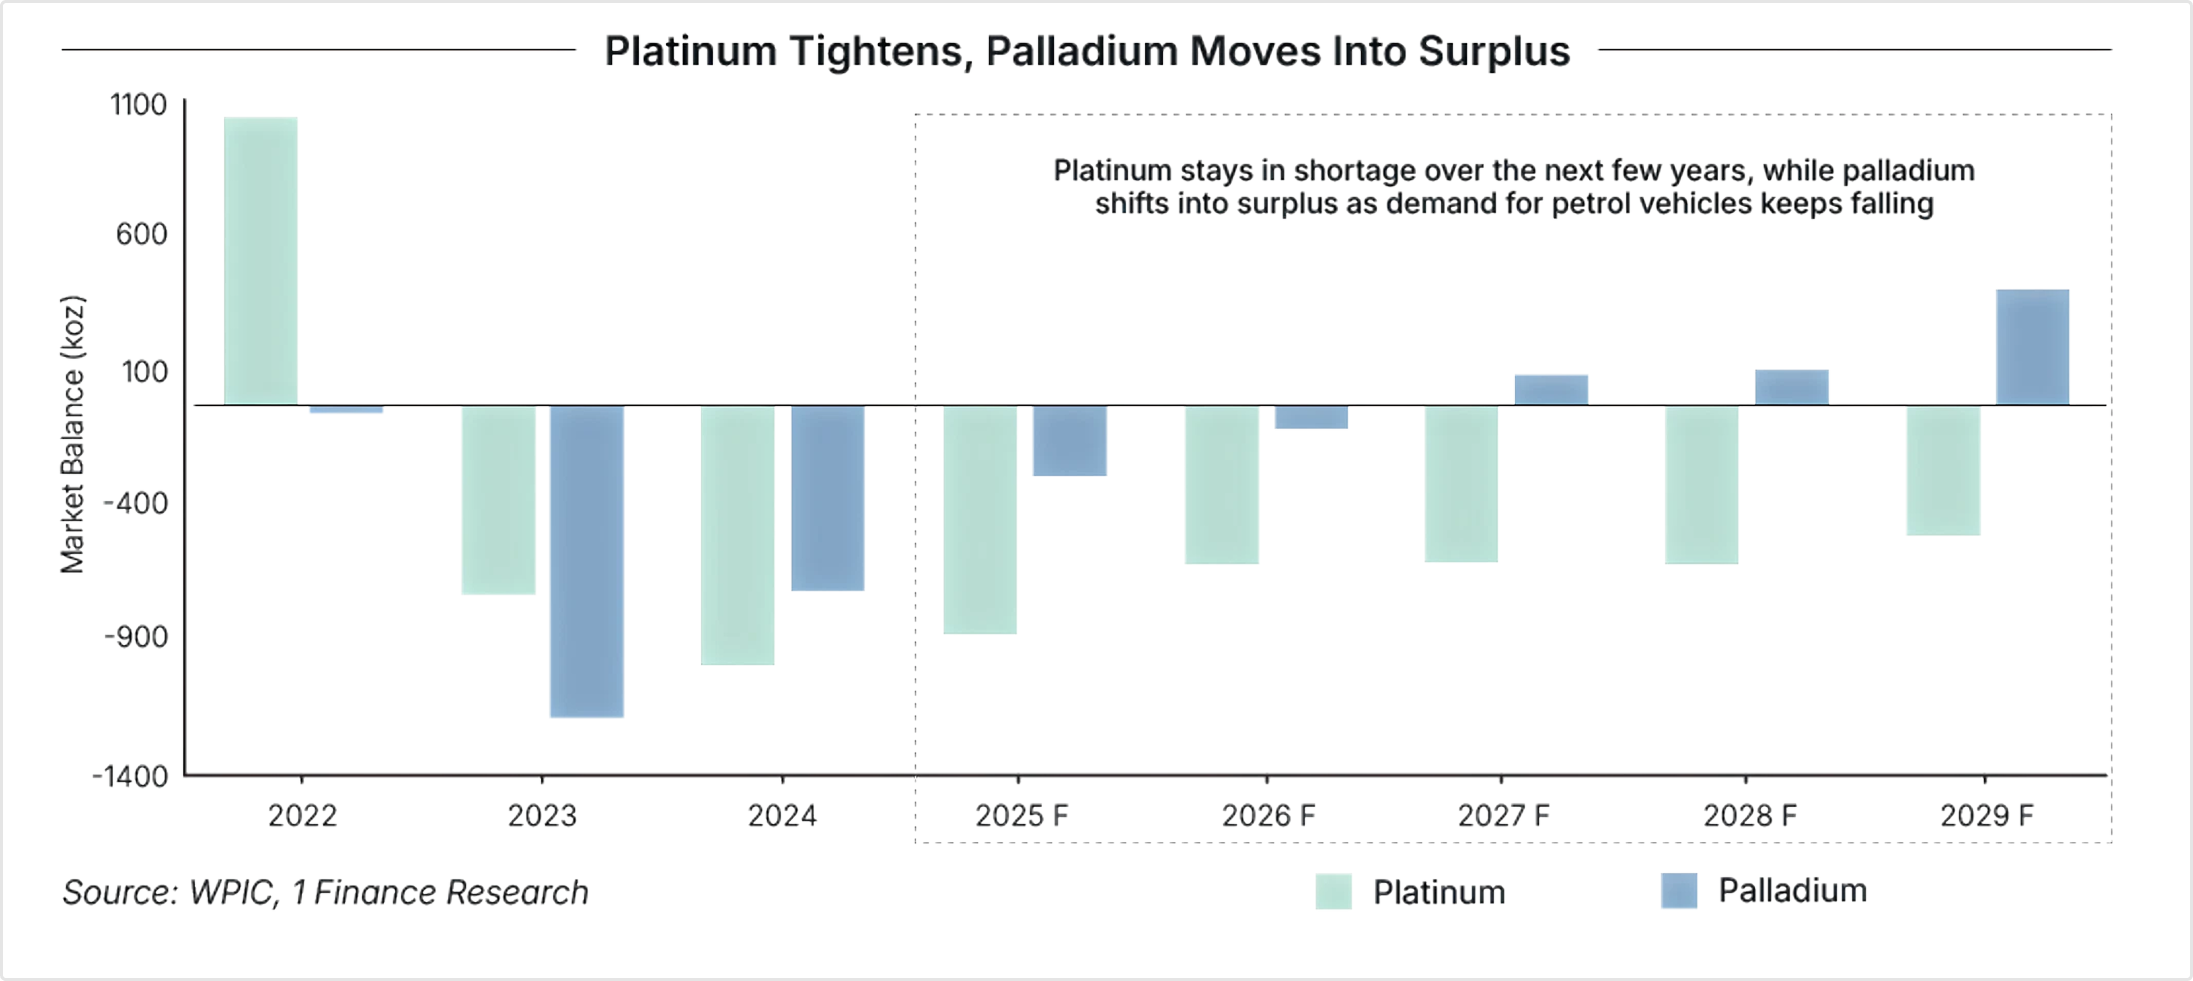
In addition, relatively attractive valuations create room for price re-rating. While investment demand may pause temporarily after the recent rally, the structural demand-supply balance supports a positive outlook for platinum in 2026.
Get a financial plan personalised to your needs
Let our Qualified Financial Advisors guide you
Advice that makes the difference


Your data security is our top priority
Through a secure infrastructure, RSA-256 encryption, disaster recovery protocols