Popular searches
Get to know your policy better
Product scoring may vary based on gender, age, policy tenure and sum assured.
Gender
Age Group

The lowest age in the selected range is considered for price evaluation (e.g., 25 - 29)
The lowest age in the selected range is considered for price evaluation (e.g., 25 - 29)
Sum Assured
80% of Mutual fund Schemes Lose 25% or More Value due to Commissions in 10 Years

Executive Summary
Commissions embedded in regular plans materially erode investor wealth relative to identical direct plans. Over 10 years, 80%+ of schemes show a ≥25% shortfall of the original investment in regular versus direct, and nearly one in five exceeds 50%—a gap driven by the compounding of higher expenses. Even over five years, 53% of schemes fall short by ≥15%.
While direct plans’ lower TERs compound into meaningfully higher long-term wealth, investor behaviour also matters: Regular investors typically stay invested longer (21.2% with >5-year holding vs 7.7% in Direct plans as of Mar ’24), which can improve outcomes.
Introduction
Commissions remain one of the most persistent and least visible forces shaping investor outcomes in mutual funds. They are built into the structure of regular plans and, over time, can silently consume a large share of the gains that funds generate over their benchmarks.
In this study, we compare Direct and Regular plans of the same schemes to show how the difference in expense ratios, driven largely by distributor payouts, translates into meaningful performance gaps.
Using historical data from schemes with both long and mid-term track records, we demonstrate how these cost differences compound into substantial wealth erosion, offering insights that every investor and industry participant should understand.
Key Findings
Commission Impact on Long-Term Schemes
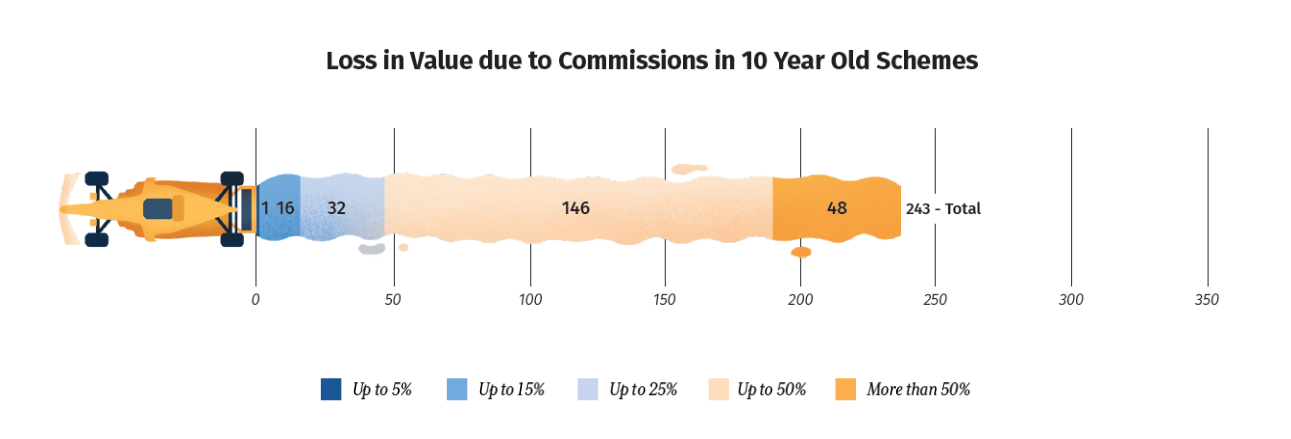
Our analysis of mutual fund schemes with over 10 years of history shows that the difference in gains between Direct and Regular plans is substantial in most cases. The higher expense ratios in regular plans are driven by distributor commissions that have resulted in significant wealth erosion over time.
Over a long holding period, more than 80% of schemes leave regular-plan investors with wealth that is lower by at least 25% of their initial investment, versus the same scheme’s direct plan. The gap isn’t due to scheme selection—it's the compounding drag of higher expense ratios in regular plans. Even small differences snowball, so the cost gap compounds into a 25%+ shortfall for four out of five schemes.
Commission Impact on Mid-Term Schemes
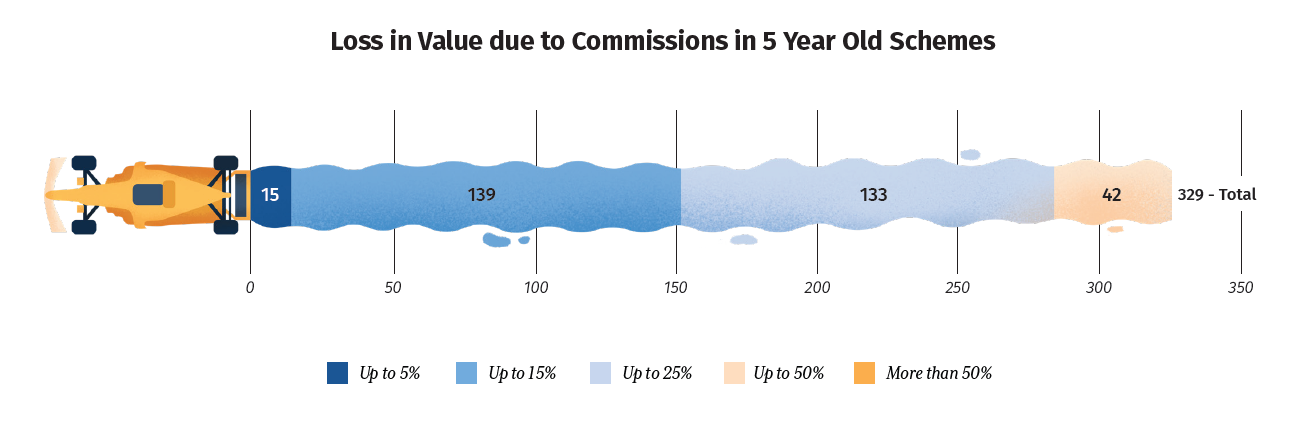
For schemes with at least 5 years of history, the difference in gains between Direct and Regular plans is smaller than in long-term schemes but still meaningful.
Over a five-year horizon, 53% of schemes lose ≥15% of the initial investment in regular vs direct plans—purely from the compounding drag of higher costs.
Conclusion
Regular plans, burdened by distributor commissions, consistently underperform their direct counterparts despite identical portfolios. Over 10 years, most schemes show a 25%+ gain gap in favour of direct plans, with noticeable differences even at 5 years. SEBI’s TER caps, being ceilings and not cost-based limits, allow regular plan costs to be set much higher within permissible limits, amplifying this gap. Lower costs in direct plans translate directly into higher investor wealth over time.
However, as per the Crisil AMFI Factbook, regular investments have a longer holding-period profile in comparison to direct investments. As of March 2024, the share of regular investments with more than 5 years of holding period stood at 21.2% as against 7.7% in the case of direct investments. Staying invested in mutual funds for a longer horizon leads to better returns; this quantitative analysis doesn’t factor in this qualitative aspect into the picture.
Calculation Methodology
- Historical Net Asset Value (NAV) data for both Direct and Regular plans of mutual fund schemes was derived from AMFI.
- Data spans multiple categories and timeframes, including NAV values from specific years (2015, 2020, 2025) and monthly NAV series.
- Scheme-level information includes:
- Plan type: Direct plan and Regular plan
- Asset type: Equity
- Category classification:
- Flexi Cap
- Large & Mid Cap Fund
- Large Cap Fund
- Thematic & Sectoral fund
- Data Selection:
- We included only those schemes with a minimum history of 5 years for the medium-term analysis and 10 years for the long-term analysis.
- For each scheme, we looked at both the Direct-Growth and Regular-Growth variants to ensure the portfolio, fund manager, and risk profile were identical.
- We used NAV data for both variants starting from the same date so that the comparison was strictly like-for-like.
- Calculation Framework
- Base Investment Assumption: We assumed a hypothetical investment of ₹100 in both the Direct-Growth and Regular-Growth plans of the same scheme on the same start date.
- Performance Measurement: We calculated the total gain for each plan after the chosen investment horizon (5 or 10 years).
- Difference Attribution: We worked out the difference in gains between the Direct and Regular plans and expressed this as a percentage of the original ₹100 investment and not as total returns.
- Categorisation: We sorted schemes into five different bands:
- Up to 5%
- 5–15%
- 15–25%
- 25–50%
- More than 50%
- Interpretation: If a scheme appears in the “More than 50%” band for the 10-year analysis, it means the Direct plan gave at least ₹50 more than the Regular plan on a ₹100 investment, purely because of lower costs.
- Scope and Limitations
- We did not include behavioural factors or tax implications in our calculations.
Table of Contents
Share:


Share: