


Comprehensive Guide to Exchange-Traded Funds (ETFs): What You Need to ...
Exchange-Traded Funds (ETFs) have become increasingly popular investment vehicles in ...
 Book a free consulation
Get advice on investing, insurance, tax planning, loan management, etc, for free with a Qualifed Financial Advisor

Multi-asset allocation funds (MAAFs) have become a favourite among investors. They have gradually shifted from the sidelines to the centre of many investment portfolios, and the numbers reflect this change. According to data from the Association of Mutual Funds in India (AMFI), total hybrid mutual fund AUM reached ₹10.88 lakh crore as on November 2025. MAAFs alone contributed close to ₹40,000 crore in inflows during Jan to Nov 2025, accounting for 27.17% of total hybrid net inflows. In comparison, MAAFs accounted for over 12% of pure equity funds net inflows, which stood at ₹3.22 lakh crore.
By combining equity, debt, commodities, and, sometimes, international assets into a single fund, multi-asset allocation funds provide an all-in-one solution. The hype around them is justified: when markets struggle, these funds generally perform better than others. They help manage volatility, rebalance automatically, and relieve investors of the burden of making asset allocation decisions. For many investors, this “invest-and-forget” approach seems like a smart strategy.
Now the question is: should you invest in multi-asset allocation funds now? In this article, we will explain how multi-asset allocation funds work, how diversified they are, what the costs of this diversification are, and whether this built-in diversification is a boon or a bane for you.
Multi-asset allocation funds are mutual funds that invest across at least three asset classes, typically equities, debt, and commodities such as gold or silver. According to the Securities and Exchange Board of India (SEBI) guidelines, every multi-asset allocation fund must allocate at least 10% to each asset class at all times. It helps ensure effective diversification. Some funds also provide limited international exposure, either directly or through fund-of-funds, while adhering to regulatory limits.
Multi-asset allocation funds typically allocate 40-60% to equities, 20-40% to debt, and 10-20% to gold or other commodities. Each asset class performs differently across market cycles. When equities face challenges, debt provides stability, and gold often rises during times of uncertainty. This structured mix helps the fund perform reliably in various market conditions. Fund managers actively monitor market trends and economic indicators to adjust the asset allocation, maintaining the right balance between risk and return. So, you don’t have to worry about anything, invest and relax.
While multi-asset allocation funds have existed in some form or another over the last 10 years, they have become more prominent in the last few years. Recent AMFI data reveals a dramatic surge: total inflows jumped from ₹48,635 crore in November 2023 to ₹1,01,688 crore in November 2024, a 109.1% rise, and then soared to ₹1,57,267 crore by November 2025, delivering a staggering 223.4% increase in just two years.
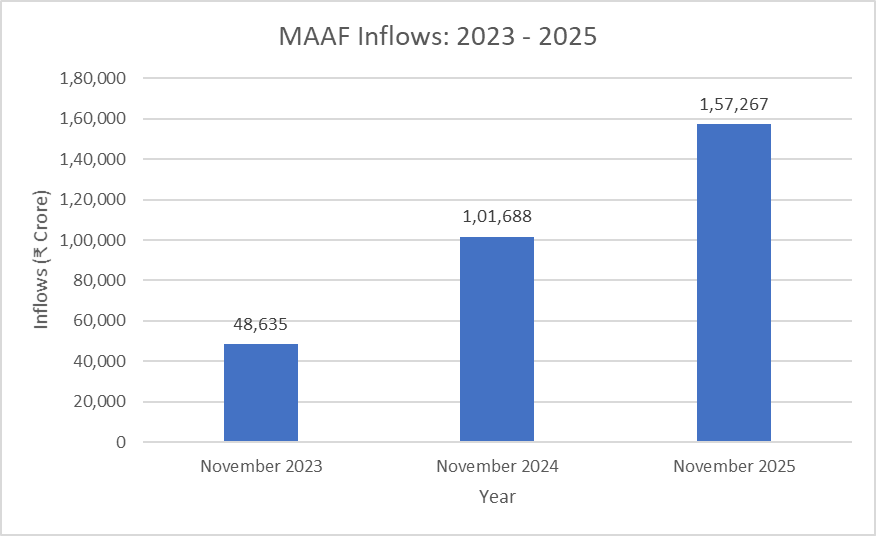
Source: AMFI
Now, let’s take a look at the top-performing multi-asset allocation funds based on 1-year, 3-year, and 5-year returns.
Top-performing multi-asset allocation funds based on 1-year returns
| Fund name | 1Y (%) |
|---|---|
| DSP Multi Asset Allocation Fund | 20.09 |
| Mahindra Manulife Multi Asset Allocation Fund | 19.15 |
| Sundaram Multi Asset Allocation Fund | 17.45 |
| Kotak Multi Asset Allocation Fund | 17.18 |
| WOC Multi Asset Allocation Fund | 17.06 |
Source: 1 Finance Research, as of November, 2025
Top-performing multi-asset allocation funds based on 3-year and 5-year returns
| Fund name | 3Y (%) | 5Y (%) |
|---|---|---|
| Quant Multi Asset Allocation Fund | 26.80 | 46.06 |
| Nippon India Multi Asset Allocation Fund | 26.41 | 26.89 |
| UTI Multi Asset Allocation Fund | 25.25 | 22.79 |
| ICICI Pru Multi-Asset Fund | 24.23 | 35.33 |
| SBI Multi Asset Allocation Fund | 22.03 | 21.55 |
Source: 1 Finance Research, as of November, 2025
To understand what’s driving these attractive returns, we analysed the asset allocation of the top-performing multi-asset allocation funds based on their 1-year returns.
Asset allocation of top-performing multi-asset allocation funds (based on 1-year return)
| Fund name | Equity (%) | Debt & Others (%) | Commodities (%) |
|---|---|---|---|
| DSP Multi Asset Allocation Fund | 62.2 | 24.2 | 13.6 |
| Mahindra Manulife Multi Asset Allocation Fund | 51.6 | 37.2 | 11.2 |
| Sundaram Multi Asset Allocation Fund | 61.94 | 15.32 | 22.74 |
| Kotak Multi Asset Allocation Fund | 66.39 | 12.69 | 20.92 |
| WOC Multi Asset Allocation Fund | 37.28 | 52.31 | 10.41 |
Source: 1 Finance Research, as of November, 2025
Scroll right to view full table –>
The insight was clear: the rally over the past year was largely driven by gold. 2025 has truly been the year of gold. Funds with significant commodity exposure, especially gold, achieved the strongest performance.
For instance:
In essence, gold emerged as the standout performer when equity markets were uncertain.
Top-performing multi-asset allocation funds, based on 3-year and 5-year returns, show even wider variation in asset mixes over longer horizons.
Asset allocation of top-performing multi-asset allocation funds (based on 3-year and 5-year returns)
| Fund name | Equity (%) | Debt & Others (%) | Commodities (%) |
|---|---|---|---|
| Quant Multi Asset Allocation Fund | 59.45 | 29.50 | 10.71 |
| Nippon India Multi Asset Allocation Fund | 55.60 | 30.94 | 13.46 |
| UTI Multi Asset Allocation Fund | 66.54 | 21.17 | 12.29 |
| ICICI Pru Multi-Asset Fund | 71.12 | 23.72 | 10.18 |
| SBI Multi Asset Allocation Fund | 43.29 | 45.75 | 10.96 |
Source: 1 Finance Research, as of November, 2025
Scroll right to view full table –>
Quant Multi Asset Allocation Fund topped 3-year returns with around 60% equity exposure. ICICI Pru Multi-Asset Fund delivered strong 5-year returns while maintaining 71.12% in equity. Meanwhile, SBI Multi Asset Allocation Fund produced solid long-term results with a more balanced 43.29% equity and 45.75% debt allocation.
This clearly shows that, over extended periods, different asset classes drive returns at different times, shaped by the prevailing market environment.
What does it cost to earn such lucrative returns from multi-asset allocation funds? Fund managers frequently rebalance between equity, debt, gold, and other assets. That’s why these funds charge higher than those of standard equity or debt mutual funds or passive ETFs.
As of late 2025, expense ratio of direct plans of the top-performing multi-asset funds typically falls between 0.23% – 1%. Regular plans are more expensive, usually higher than 1%, due to distribution commissions.
This brings us to a fair question: If a fund’s returns are largely driven by gold exposure during a specific period, why not invest directly in a gold ETF? Gold ETFs generally charge between 0.2% – 0.5%, offering similar gains from gold at a relatively lower cost. Paying active management fees for something that can be replicated cheaply is efficient.
The built-in diversification of multi-asset allocation funds is often promoted as an easy way for investors to diversify their portfolios. However, this approach has several drawbacks and tends to be a one-size-fits-all solution. The main issue is that, aside from the required minimum of 10% in each asset class, the actual allocation is determined entirely by the fund manager. It does not take into account your personal needs, your existing asset allocation, preferences, or changing life circumstances. Important factors such as your financial personality, age, income, goals, time horizon, and overall portfolio asset allocation are overlooked. Changes in the fund are driven solely by market conditions and broader economic trends, rather than by your individual circumstances.
For example, the ICICI Pru Multi-Asset Fund has about 71% equity allocation, resembling an aggressive hybrid or equity-oriented strategy more than a conservative multi-asset approach. This type of fund is suitable for long-term investors who can tolerate volatility for potentially higher returns. On the other hand, the SBI Multi Asset Allocation Fund has a higher debt allocation, catering to those who prioritise stability, as the debt component helps cushion against volatility in stock markets.
Unfortunately, when selecting these funds, you may not be aware of these details, as many investors do not closely examine the funds’ specific holdings.
In summary, while built-in allocation may offer convenience, it sacrifices personalisation.
It’s important to remember that many multi-asset allocation funds lean heavily towards equity. During market downturns, the mix may not provide the expected protection, especially in equity-heavy versions.
Active management and continuous rebalancing result in expense ratios that are generally higher than those of index funds or ETFs.
If you already own other mutual funds, adding a multi-asset allocation fund may lead to overlap in your portfolio and increase exposure to certain stocks or sectors.
Identify mutual fund overlap in your portfolio using our Mutual Fund Overlap Calculator
Let’s show you with an example how the convenience of built-in asset allocation costs you more in the long run.
Scenario 1: Your personalised portfolio
| Asset | Allocation (%) | Monthly SIP | Total amount invested (15 yrs) |
|---|---|---|---|
| Index-based equity | 65 | ₹30,000 | ₹54 lakh |
| Debt | 20 | ₹15,000 | ₹27 lakh |
| Gold ETF | 15 | ₹5,000 | ₹9 lakh |
| Total | 100 | ₹50,000 | ₹90 lakh |
Source: 1 Finance Research
Scroll right to view full table –>
To know the true cost of maintaining your portfolio, you need to calculate the effective expense ratio.
| Asset | Portfolio allocation (%) | Expense ratio (ER) (%) |
|---|---|---|
| Index-based equity | 65 | 0.10 |
| Debt | 20 | 0.40 |
| Gold ETF | 15 | 0.55 |
Source: 1 Finance Research
Multiply each allocation by its expense ratio:
This means 0.23% of your portfolio value is deducted every year as cost, setting a very different compounding trajectory compared to a typical multi-asset allocation fund.
Scenario 2: A MAAF investment (direct plan)
Here’s the result of the 15-year cost comparison between your low-cost portfolio (0.23% ER) and a typical multi-asset allocation fund (0.6% ER):

Source: 1 Finance Research
The chart above clearly illustrates how even a small difference in annual fees can snowball into a significant long-term loss. Although the expense ratio gap seems modest at 0.37%, over 15 years, it compounds into a staggering shortfall of ₹24.4 lakh. This means that more of your gains are eroded each year, preventing them from compounding further. In contrast, a personalised, low-cost portfolio minimizes fees, allowing more of your returns to stay invested and compound over time. This directly enhances your final corpus. The chart’s rising blue bars highlight the growth of the portfolio base due to lower fees, while the orange line shows how this compounding advantage progressively boosts the overall value.
Multi-asset allocation funds have become increasingly popular for good reason; they offer a ready-made diversified portfolio in one product with hands-off management in an uncertain world. However, as we’ve seen, their pre-packaged approach often has limitations: allocations driven by fund mandates rather than your changing circumstances, higher costs that compound over time, and limited protection during market volatility.
Multi-asset allocation funds can serve as a solid entry point for investors, but it’s important not to jump in blindly. Even for beginners, it’s crucial to ensure that the fund’s allocation matches your needs, compare expense ratios, understand the underlying components, and confirm that it aligns with your goals.
Treat multi-asset funds as a helpful starting point, but not a lifelong solution. As your income grows, your goals become more complex, and your understanding deepens, a more personalized approach will be more beneficial. Consulting a Qualified Financial Advisor (QFA) is important in this process. A good financial advisor can help you transition from a convenient, one-size-fits-all fund to a tailored asset allocation that evolves with your life stages, needs, and other factors.

The views in the article /blog are personal and that of the author. The idea is to create awareness and not intended to provide any product recommendations.


Get advice on investing, insurance, tax planning, loan management, etc, for free with a Qualifed Financial Advisor
Explore
Exchange-Traded Funds (ETFs) have become increasingly popular investment vehicles in ...

The journey of generating wealth begins with a simple sound financial decision that i...

In 2017, the Securities and Exchange Board of India (SEBI) introduced new guidelines ...
