Popular searches
Get to know your policy better
Product scoring may vary based on gender, age, policy tenure and sum assured.

Gender
Age Group

The lowest age in the selected range is considered for price evaluation (e.g., 25 - 29)
The lowest age in the selected range is considered for price evaluation (e.g., 25 - 29)
Sum Assured
How Would an All Stock Index Have Performed in India?
How Would an All Stock Index Have Performed in India?
Ever wondered what the Indian stock market’s true potential looks like beyond just the Nifty 50 or Nifty 500? Let’s explore the bigger picture with an All Stock Index (ASI), capturing the entire market’s pulse over two decades.
The Problem
Indices like the Nifty 50 and Nifty 500 dominate market tracking but only represent a small segment of listed companies. Together, they account for ~44.37% and ~91.21%, respectively, of the NSE’s total market capitalisation but exclude thousands of smaller companies, leaving out broader market opportunities.
We, therefore, analysed how an all-encompassing index performed over the last 24 years. This can offer a holistic view of the broader Indian market for investors
Key Features of the All Stock Index
- Coverage: Tracks 4,337 investable stocks as of July 31, 2024.
- Broader representation: Incorporates microcaps alongside large and mid-cap companies, offering significant growth opportunities despite higher volatility.
- Free-float methodology: Uses free-float market capitalisation to reflect the true market value of available shares.
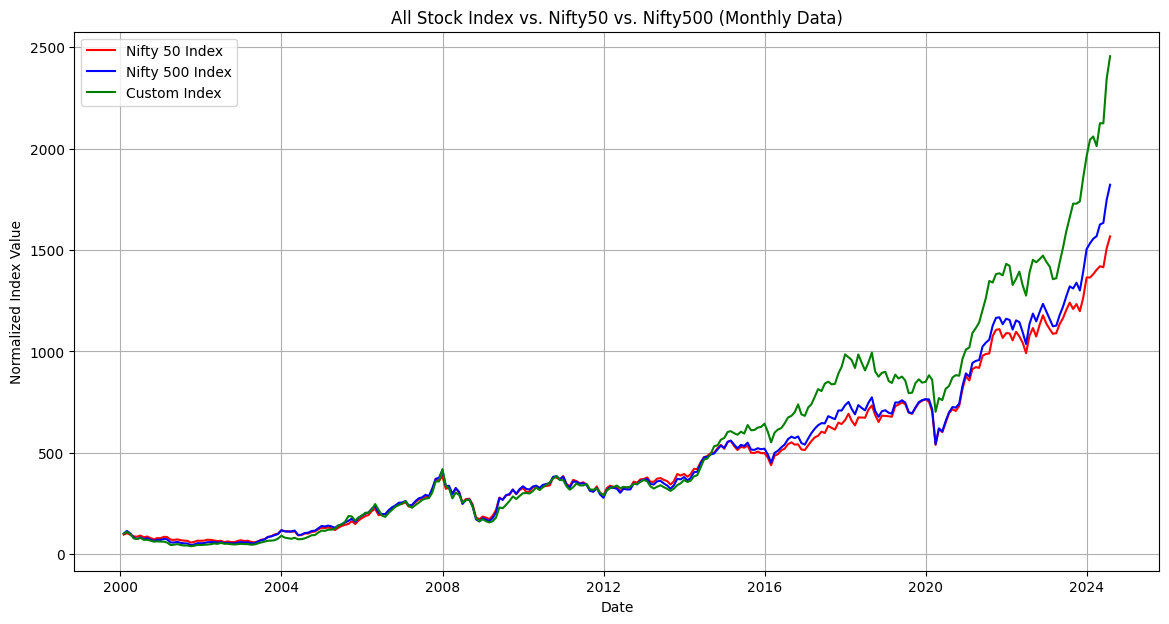
Historical Performance: All Stock Index vs Nifty 50 vs Nifty 500
The All Stock Index''s performance over two decades highlights its broader market exposure. While it often surpasses traditional indices in high-growth years, it’s more susceptible to downturns due to microcap volatility.

Source: CMIE, 1 Finance
Risk-Adjusted Returns
Using metrics like the Sharpe and Sortino ratios, we evaluated ASI’s risk-adjusted returns:
- Sharpe Ratio: Measures excess returns over the risk-free rate relative to volatility. The ASI outperformed traditional indices in high-growth years but showed steeper declines during downturns.
- Sortino Ratio: Focuses on downside risk. Despite higher volatility, the ASI offered superior returns when adjusted for risk, although it suffered in volatile years.
Microcaps Drive High Growth
The ASI encompasses large, mid, small, and microcaps. Microcaps, though volatile, have shown extraordinary growth, especially post-2020. While large caps provide stability, small and microcaps add growth potential, albeit with higher risk during economic crises.

The ASI’s broader coverage makes it more sensitive to downturns, such as the 2008 financial crisis and the COVID-19 pandemic. Despite deeper declines, its long-term recovery often outpaces traditional indices, demonstrating resilience and growth potential.
India’s increasing number of listed companies reflects economic expansion. The ASI’s approach captures this growth, providing a robust market performance snapshot across sectors and market capitalisations.
Challenges in Replicating the ASI
Anil Ghelani, CFA, Head of Passive Investments at DSP Mutual Fund, highlights replication challenges due to liquidity issues in microcaps and trading restrictions. Unlike in the US, where ETFs use risk-based optimisation, Indian index funds must fully replicate their benchmarks.
The ASI offers a more accurate and inclusive view of India’s stock market performance, capturing exposure to high-growth, high-volatility sectors and emerging market trends.
However, while the overall market represented by this index shows strong return potential, replicating such an index can be challenging due to liquidity issues of micro-cap stocks.
To access the complete research work. It''s about creating a community of financial advisors, asset managers, and the leaders of BFSI and Fintech industries.
If you’re one of them and want a copy, fill out the form here and join the waitlist.
Table of Contents
Share:


Share: