Popular searches

Get to know your policy better

Product scoring may vary based on gender, age, policy tenure and sum assured.

Gender
Male
Age Group

The lowest age in the selected range is considered for price evaluation (e.g., 25 - 29)

30 - 34
Sum Assured
₹ 1Cr
Back
Download
Fund Logo

Active FundsSector FundsNIFTY PHARMA - TRI

ICICI Pru Pharma Healthcare & Diagnostics (P.H.D) Fund-(G)-Direct Plan

1 Finance Rank:
15
1 Finance Score:
70100
Sharpe Score
78
Sortino Score
79
Jensen's Score
85
Treynor Score
54
Information Ratio Score
73
Drawdown Score
14
Crash Recovery Score
57
P/E & P/B Score
79
Fund Mgr.Score
84
by 1 Finance Research
1 Finance Scores reflect a holistic assessment of fund performance, risk, and costs.
AUM
₹ 6,293 Cr(As on 31-Mar-2026)
NAV
₹ 41.83(As on 24-Apr-2026)
R- Squared
0.3%
Fund Age
7 years
No. of Stocks
39(As on 31-Mar-2026)
Expense Ratio
1.05%(As on 31-Mar-2026)
Fund Logo

15

Active FundsSector FundsNIFTY PHARMA - TRI

ICICI Pru Pharma Healthcare & Diagnostics (P.H.D) Fund-(G)-Direct Plan

This fund ranks 15th out of 82 funds in its category.

AUM₹ 6,293 Cr(As on 31-Mar-2026)
NAV₹ 41.83(As on 24-Apr-2026)
R- Squared
0.3%
Fund Age
7 years
No. of Stocks39(As on 31-Mar-2026)
Expense Ratio1.05%(As on 31-Mar-2026)
1 Finance Score: 70/100
Sharpe Score
78
Sortino Score
79
Jensen's Score
85
Treynor Score
54
Information Ratio Score
73
Drawdown Score
14
Crash Recovery Score
57
P/E & P/B Score
79
Fund Mgr.Score
84
by 1 Finance Research
1 Finance Scores reflect a holistic assessment of fund performance, risk, and costs.

Rolling Returns

Avg. Rolling Returns1 year3 year5 year7 year
Avg. Rolling Returns
1 Years
3 Years
5 Years
7 Years

“80% of mutual fund schemes lose 25% or more value due to commissions in 10 years.” Source: 1 Finance Research

Fundamental Ratios

Score Trend

1000
Sharpe Ratio
0.119
Sortino Ratio
0.199
Treynor Ratio
0.157
Jensen's Alpha
0.067%
Information Ratio
0.068
Drawdown
-24.19%
Crash Recovery
402 days
P/E ratio
42.2
P/B ratio
5.5
Fund Age
7 years
Beta
0.6
Std. Deviation
0.79%

*Most top-ranked mutual funds won't hold their rank for long. Source: 1 Finance Research

Portfolio summary

Asset Allocation

Equity
Others
Debt
97.62%
2.35%
0.03%

Market Capitalisation

Large Cap
33.22%
Mid Cap
27.88%
Small Cap
36.52%
Others
2.38%

Equity Sector Allocation

Pharmaceuticals & Drugs
82.8%
Business Support
5.13%
Hospital & Healthcare Services
3.44%
Retailing
2.73%
Trading
1.9%
Other
1.06%

Top Holdings

Holding NamesAssets (%)
Sun Pharmaceutical Industries Ltd.12.05%
Cipla Ltd.7.90%
Dr. Reddy's Laboratories Ltd.7.82%
Divi's Laboratories Ltd.7.10%
Mankind Pharma Ltd.6.44%

*Most active equity funds don't beat their own benchmark over the long run. Source: 1 Finance Research

Peer comparison

Fund List1 F scoreFund SizeExpense Ratio

Pros and Cons

Pros
Strong Sharpe ratio indicating superior risk adjusted returns.
High Treynor ratio signifies better return for the market risk undertaken.
Positive Jensen’s Alpha shows outperformance over CAPM expectations for the risk taken.
Smaller drawdowns and faster recoveries indicate strong portfolio resilience during market downturns.
Cons
A low Sortino ratio indicates poor management of downside losses.

Should you invest?

Invest if you are :

  • High conviction in sector performance in the near or long-term.

Avoid if you are :

  • Unwilling to take the risk of investing in a particular sector or theme.

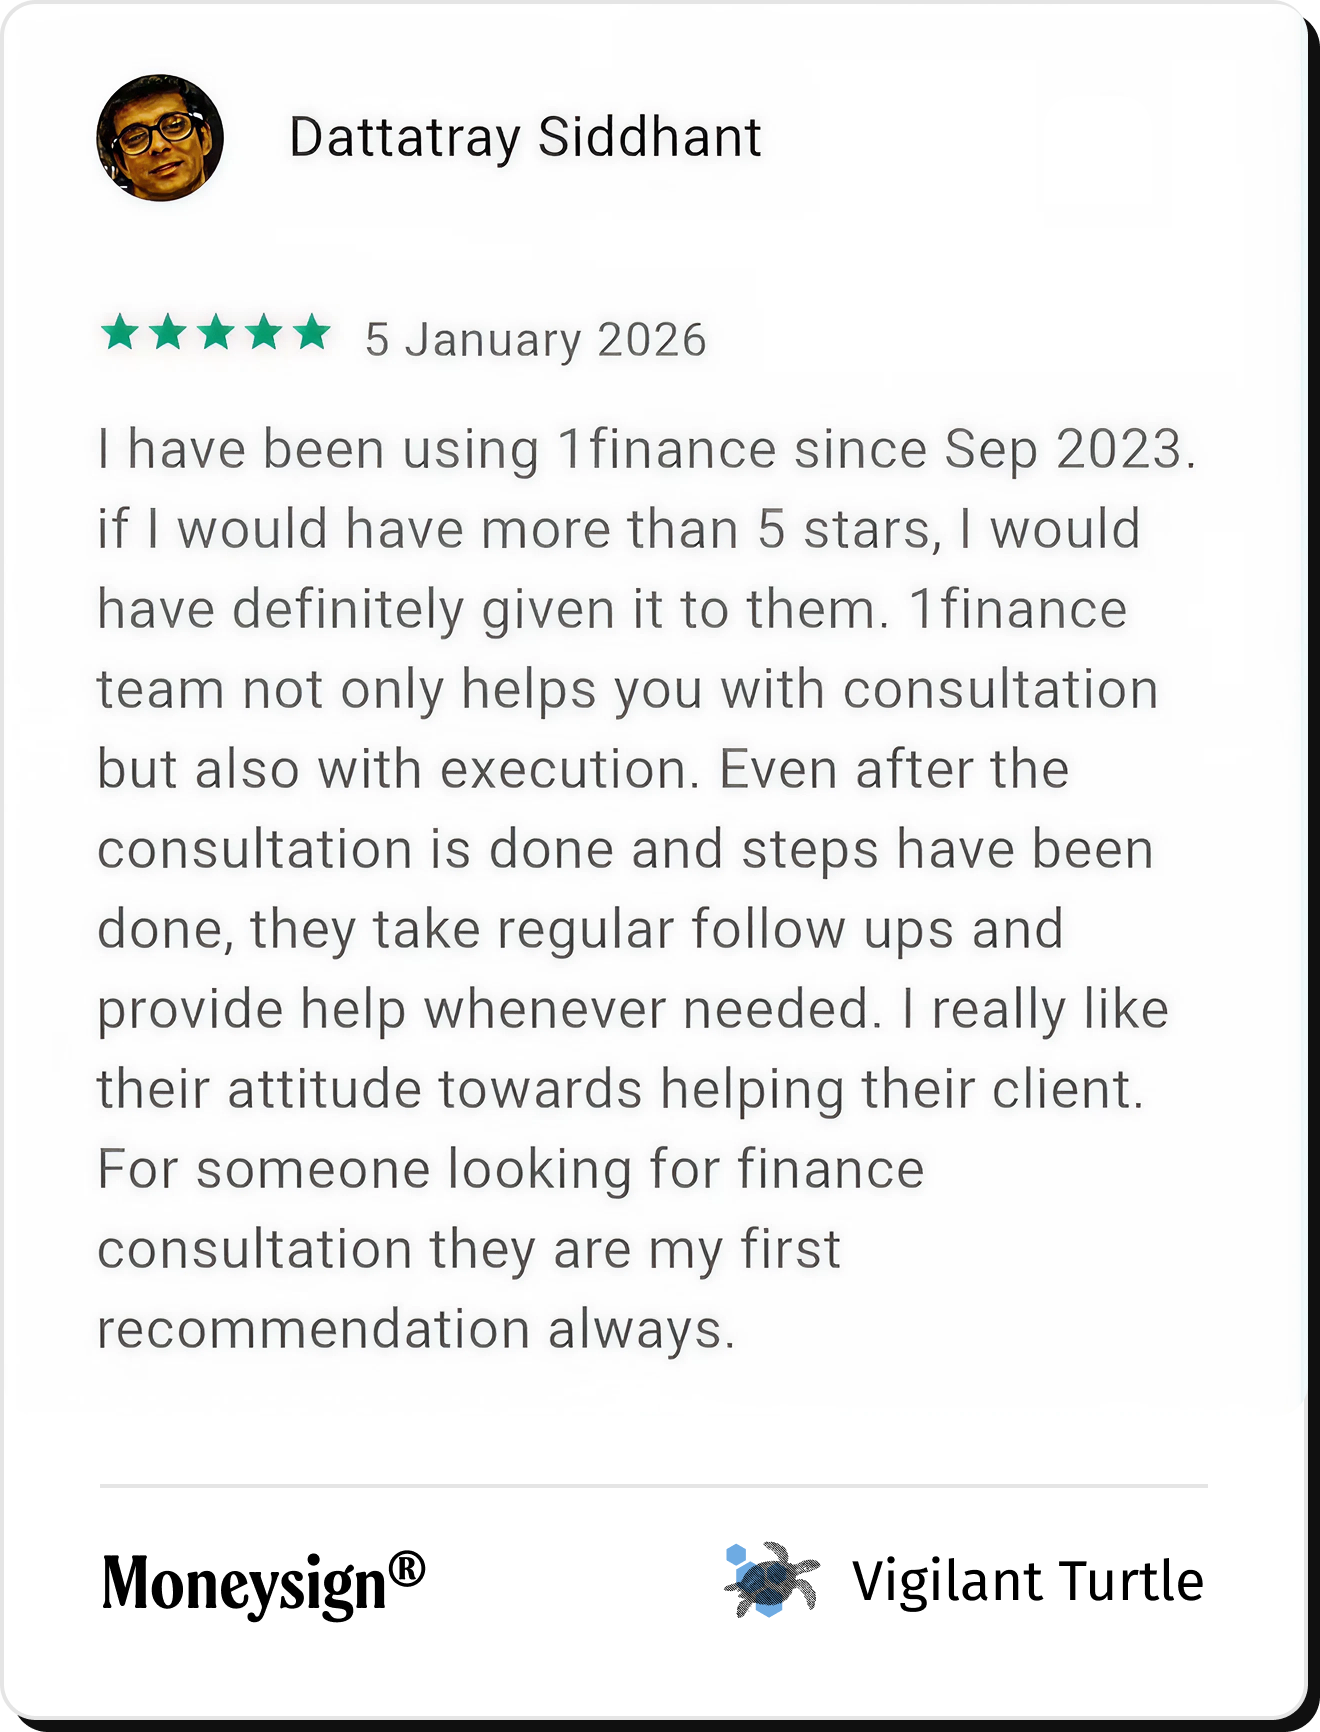
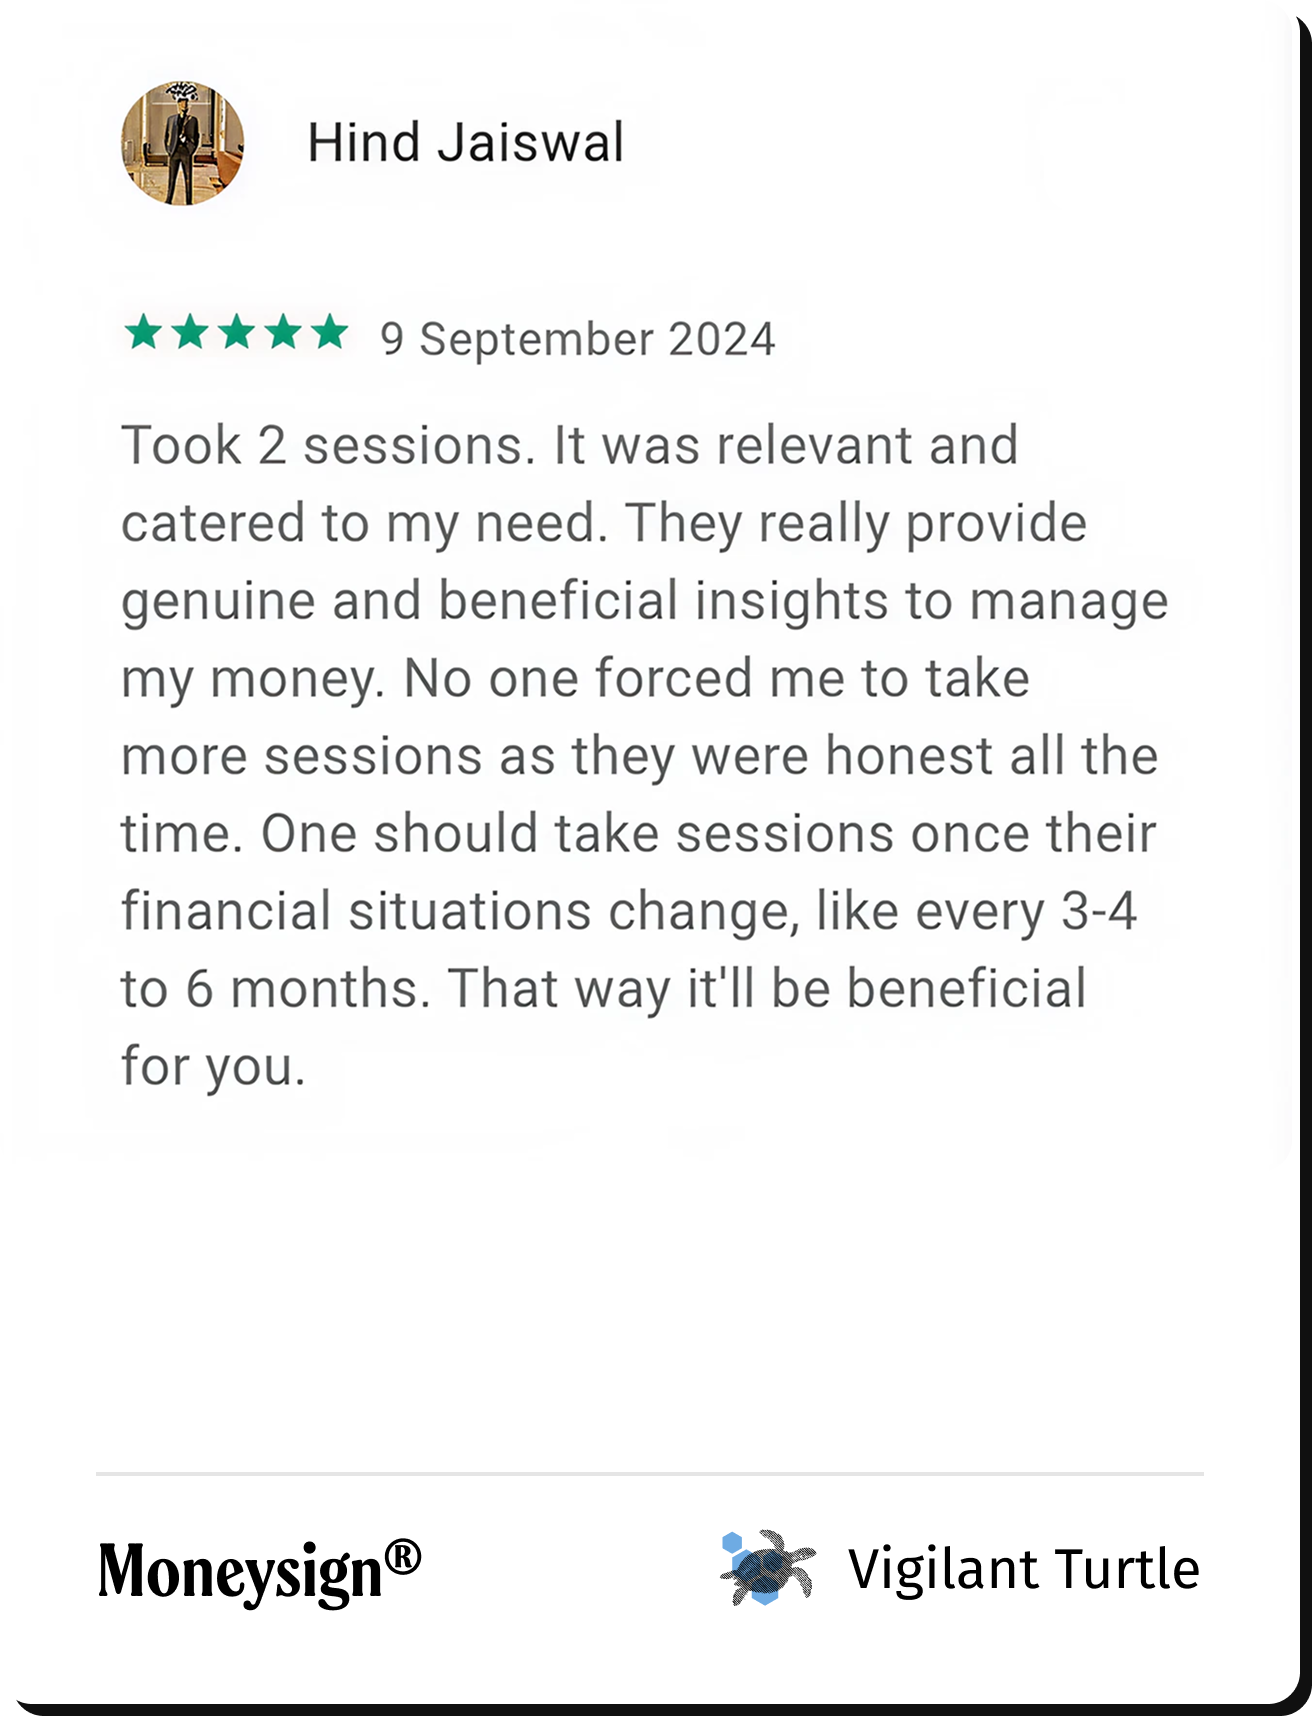
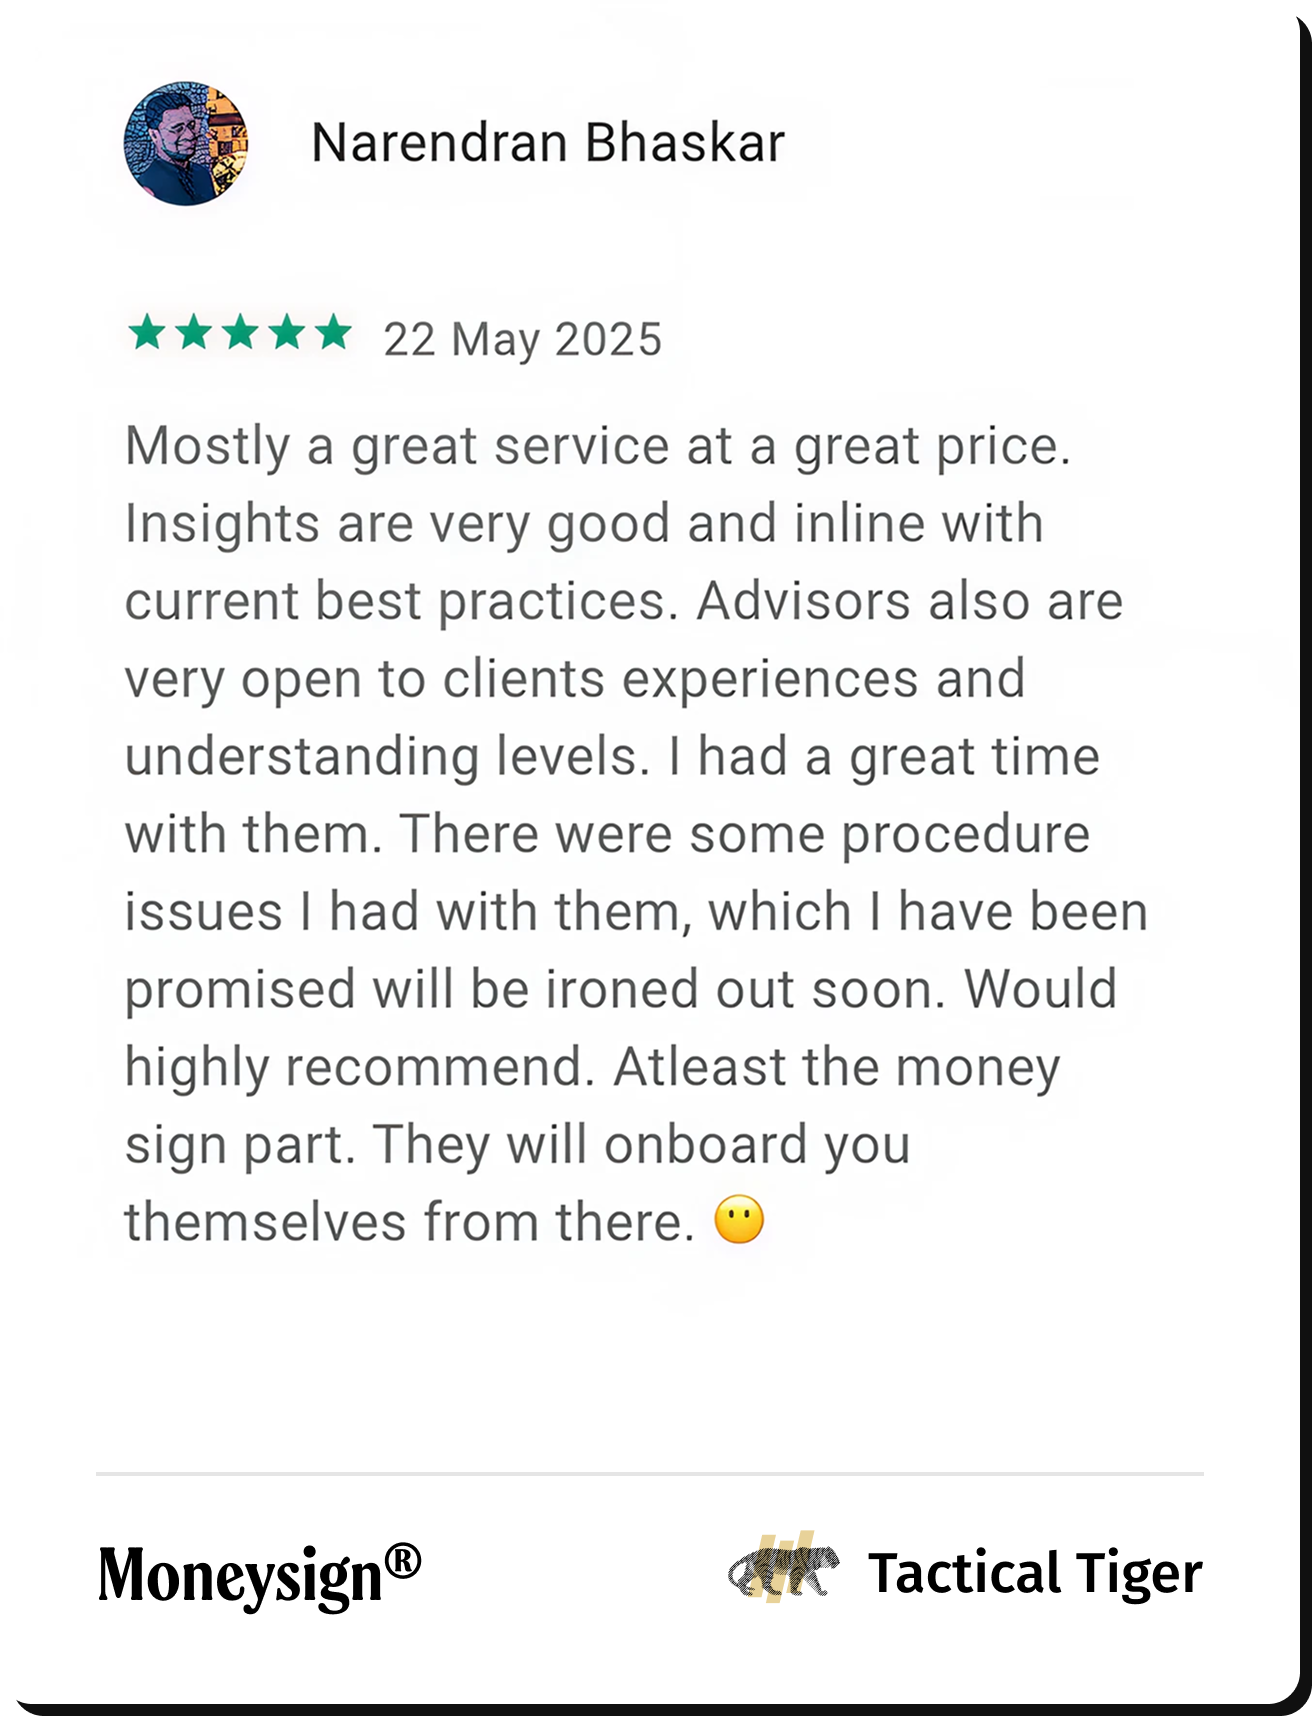
*Most financial mistakes aren't about money — they're about personality. Find yours with MoneySign®

Taxation

If sold before 1 year

  • short-term capital gains taxed at 20%.

If sold after 1 year

  • long-term capital gains above ₹1.25 lakh taxed at 12.5%.

Scheme Details

Scheme Objective

  • To generate long-term capital appreciation by creating a portfolio that is invested in Equity and Equity related securities of pharma, healthcare, hospitals, diagnostics, wellness and allied companies.However there can be no assurance that the investment objectives of the scheme will be realized.

Exit Load

  • 1% on or before 15D, Nil after 15D

Minimum investment amount

Lumpsum

5000 (open for subscription)

Other details

Founded In2018
Fund Manager NameTotal Exp. (Years)No. of Funds Managed
Dharmesh Kakkad6.62

About ICICI Pru MF

  • ICICI Prudential Mutual Fund, a 50:50 JV between ICICI Bank and Prudential plc (UK), was formed in 1998 from Mumbai. As one of India's oldest private AMCs, it harnesses banking and insurance synergies.

Don't chase past returns.
Build a portfolio for the future

Advisor 1Advisor 2Advisor 3

Our Advisory Includes

  • Portfolio diversification
  • Mutual fund tax harvesting
  • Fund overlap check & more

Your first financial plan is free

We look where past returns don't

Your data security is our top priority

Through a secure infrastructure, RSA-256 encryption, disaster recovery protocols

AWS
OAuth 2.0
CISA
Let's Encrypt
SSL Secured

Frequently Asked Questions

Are equity funds risky?

Yes, equity mutual funds do involve market risk because their returns depend on stock price changes. However, what seems risky for one person may not be for another. So the question is: Are equity mutual funds risky for you? To understand your overall financial personality, check our MoneySign®.

Talk to a Qualified Financial Advisor before making any financial decisions.

What is the minimum amount I need to start investing in an equity mutual fund?

You can start investing in equity mutual funds with as little as ₹500 a month through SIPs or ₹1,000 as a one-time payment. The amount you decide to invest should align with your budget and financial goals.

How long should I stay invested in equity mutual funds?

Equity mutual funds are well-suited for your long-term goals. It is best to keep your mutual fund investment for at least 7 to 10 years. The longer you invest, the more you can benefit from rupee-cost averaging and compounding, which helps grow your wealth. When opting for equity mutual funds, be sure to consider your investment horizon, though this should not be the only factor.

How many equity funds should I hold?

Most investors should consider holding no more than 2 to 3 well-diversified equity funds. Having too many funds can lead to overlap (owning the same stocks under different names). Therefore, focus on choosing high-quality, consistent funds rather than trying to hold too many. If you have too many mutual funds, check the Mutual Fund Overlap Calculator to identify overlap in your portfolio.

How much of your portfolio should be in equity funds?

Your ideal investment mix depends on several personal factors, including your age, profession, financial responsibilities, demographic profile, emergency fund levels, and overall financial personality. Avoid oversimplified formulas like the 50/30/20 rule or "100 minus your age" for determining equity allocation. These rules are outdated and overly generic. A personalised financial plan is far more effective because it aligns your portfolio with your real-life circumstances, helping you manage risk better and achieve more meaningful long-term results.

What is the difference between direct and regular plans?

Direct plans are purchased directly from the Asset Management Company (AMC) without distributor commissions, resulting in lower expense ratios and potentially higher long-term returns. In contrast, regular plans are sold through intermediaries and include commission costs within the expense ratio.

Can I switch from a regular plan to a direct plan for equity mutual funds?

Yes, you can. You are allowed to switch from one plan to another; however, this is treated as a redemption and reinvestment, which can trigger capital gains tax and may have exit load implications. Ensure you review your holding period and tax efficiency before making the switch, or consult your financial advisor.

How do I choose between large-cap, mid-cap, and small-cap funds?

Investors should allow the fund manager to determine the appropriate mix of large-cap, mid-cap, and small-cap exposure, rather than attempting to manage it themselves. This is why investing in a flexi cap fund is often a better choice; it provides the fund manager with the flexibility to adjust allocations based on market conditions, making it more suitable than holding separate mid-cap, small-cap, or sector-specific funds.

Disclaimer

The Information in the scoring and ranking model is provided solely for general information and educational purposes and shall not constitute any advice or recommendation. Mutual Fund investments are subject to market risks. Please read all scheme-related documents carefully before investing. Past performance is not an indicator of future returns.

Don't chase past returns.
Build a portfolio for the future

Advisor 1Advisor 2Advisor 3

Our Advisory Includes

  • Portfolio diversification
  • Mutual fund tax harvesting
  • Fund overlap check & more

Your first financial plan is free